| Home | Welcome | What's New | Site Map | Glossary | Weather Doctor Amazon Store | Book Store | Accolades | Email Us |
 | |||||||||||||||||||||||||||||||||||||||||||||||||
Weather Almanac for December 2012THE INFAMOUS LONDON SMOG OF 1952In the October edition of this Almanac, I wrote about the hazardous that can arise from anticyclones/high pressure systems. One of those hazards is the accumulation of air pollutants that can cause human health problems. I noted in that article that the most infamous of such weather conditions occurred over London, England in December of 1952. During that multi-day episode, British health authorities estimated at the time that over 4,000 people died and another 100,000 more took ill from the effects of high levels of sulphur dioxide and suspended particles in the air as well as other pollutants not measured. Later epidemiological research into the incident suggests that the number of fatalities attributed to the smog may have been as high as 12,000 premature deaths. Either number is a tragedy of epic proportions — compare them with the death toll of Hurricane Katrina set at over 1800. The event led to the implementation of many local air quality regulations including the British Clean Air Act of 1956. But it was not the first time that such conditions had posed a health risk that produced local laws and regulations in London and England. In Thirteenth Century England, excessive smoke in London annoyed the monarchy to such an extent that the first of many English Smoke Abatement Laws was passed in 1273. In 1307, Edward I prohibited the burning of sea coal in the cities under a maximum penalty of death. John Evelyn brought renewed concerns for the issue of smoke pollution to the attention of the throne three centuries later was. In his 1661 thesis Fumifugium: or the Inconvenience of the Aer and Smoake of London Dissipated on the problem presented to Charles II, he hypothesized that pollution from smoke was shortening the lives of Londoners. His views were several centuries ahead of contemporary though in his time. The problem grew worse with the dawning of the Industrial Revolution in the late Eighteenth Century when the burning of British coal, high in sulphur content, fueled the great factories and railroads that characterized the period. The pea-soup fogs that characterized Dickens' London — as the passage from Bleak House so aptly describes — arise from the combination of local weather conditions that allowed fog formation and the added components of sulphur dioxide and particles that made them worse.
While several Select Committee hearings and reports were established in the first two hundred years of the Industrial Revolution and some legislation tried to alleviate the problem, the overall effects were minimal as the bad air was seen as an unfortunate byproduct of great wealth creation. In 1905, the phenomenon of fog combined with the constituents of smoke finally earned a name. Coined in a report to the Manchester Conference of the Smoke Abatement League of Great Britain, Dr Henry Antoine Des Voeux combined the words smoke and fog to produce the new term: smog. (With increased regulations and changes in industrial processes, the factors behind this classic definition have diminished greatly. In the 1960s, smog started to take a new meaning. The hazy conditions, arising from sunlight acting on emissions from a high density of automobiles, in Southern California began to be called Los Angeles smog, and then just smog. The scientific definition would term it photochemical smog — a distinctly different form of air pollution than the classic London smog. But with the rise of photochemical smog and a decrease in smoke-related smog, the term shifted meaning around the 1980s.) The London Scene – 1952The rebuilding of Britain following the Second World War was initially fueled by a low-grade, high-sulphur British coal. (The less polluting, low-sulphur coal that brought a higher price per ton was generally exported to bring much needed funds into the nation.) The growing population around London with increases in electrical power generation, industry, and transportation brought rising emissions of the pollutants that made up London (or fuliginous) smog. The mix of pollutants high in smoke particles and sulphur compounds produced conditions that we now know are extremely detrimental to human health. It was, to use the old cliche, a disaster waiting to happen. The November 1952 weather in England was significantly colder than normal, with heavy snowfalls in southern England towards month's end. The early days of December brought a respite from the cold weather to the region, and 3 December was the finest. The clear skies brought a touch of morning frost but under fresh winds, the chill blew away and the temperature rose to 3.9o C (39o F), but it was obvious to local forecasters that a change was coming. The cold air mass that would cover London and the surrounding region still sat hundreds of kilometres to the northwest at the end of the day. The London Weather Scene – 4-9 December1952On the morning of 4 December, temperatures registered lower than the previous day and the humidity had risen. The moderate winds began to drop as a grey stratus overcast moved over London. The anticyclone the forecasters were watching covered most of the British Isles from Ireland east to Scotland and southward across Central England. If the cell continued to slide across Britain, heavy smog conditions could arise. The forecasters did issue warnings for smoggy conditions, but they did not believe that the adverse conditions would be long lasting. However, unbeknownst to them the air mass was not sliding through, but sliding to a halt over southern England. When the cold air mass, centered about 320 km (200 miles) northwest of the city, became established over the region on 4 December, its weather typified that of a cold maritime anticyclone as it settled in. Its winds were light if they blew at all, and the descending air at its center produced a subsidence inversion (warmer air above lying cold) that effectively trapped any pollutants released within the atmosphere's surface layer. At first, the calm and clear skies allowed an unabated loss of surface heat through infrared radiation, bringing the inversion bottom to the ground. Then overnight, the temperature near the ground fell to the condensation point, and fog began to form. The fog thickened as the combination of pollutants increased in the air mass. (Sulphur compounds mixed with the water in the air formed hydroscopic sulphuric acid particles, which, along with the floating soot particles, increased the density of the fog.) Once the fog thickened over the region, it attenuated what little sunlight tried to shine through during the brief daylight hours of early December. The colder temperatures prompted Londoners to burn more coal to stay warm, and the shorter days upped the demand for electricity, generated by coal-fired power plants in Battersea, Bankside, and Kingston upon Thames. As the stagnant air mass sat over London and environs, the emitted pollutants remained within it. Unable to rise away from the city due to the inversion nor move outward from it due to the calm winds, and the situation worsened. The smog, described as yellow-black and sooty, became a thick pea-souper. The sulphur and other chemical compounds combined with the sooty particles produced a sensible brew that burned eyes, noses and throats on its deadly path into the lungs. Contemporary accounts of the thickness of the smog read like a disaster movie as visibility shrunk to a few metres, only it was a real disaster unfolding. By Friday morning (5 December), the smog thickness, trapped in a layer from 100-200 metres deep, was described as the worst in memory. Weather observations set the visibility as low as a few metres. In central London it remained below 500 meters (1640 ft) continuously for 114 hours and below 50 m (164 ft) continuously for 48 hours. At Heathrow airport, the visibility fell to and remained at or below 10 m (30 ft) for almost 48 hours beginning the morning of 6 December. The wind had died to calm or nearly so. At the observation station at Kingsway, the wind had remained calm for 42 hours by Saturday evening, and at Kew Gardens it measured but 1 knot. The adverse conditions forced the postponement of a University Association Football match scheduled at Wembley Stadium, the first time any event had been canceled there since it opened in 1923. As well, most rugby and Association Football League matches in London were not played. West of London at White City, the greyhound races came to a halt when the dogs could no longer see the mechanical chase hare. On the Isle of Dogs in the Thames, the fog was reportedly so dense that people could not see their feet. Some reports indicated that, ironically, pedestrians were being helped through the streets by the blind. City buses halted in the dense fog, unable to navigate and officials pulled them from the streets. Most required assistance in seeing more than a few feet ahead. As a result, many returned to their home garages with the help of flare men who walked before the vehicles carrying flares. In one reported incident, a fleet of seventeen of London's iconic double-decker buses formed a convoy, described as a “huge, red, metallic caterpillar,” snaked through the London streets. The lead bus escorted by conductors tortuously showing the way with sputtering flares. 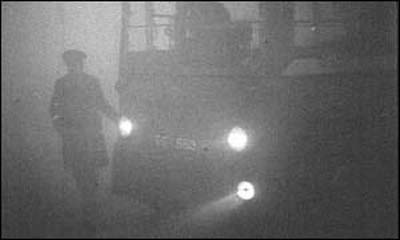 London buses try to move |
|||||||||||||||||||||||||||||||||||||||||||||||||
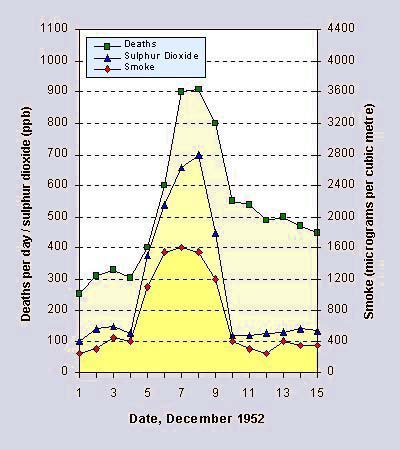
| Date | Sulphur | Smoke Particles |
| December 1952 | (parts per million of air) | (milligrams per cubic metre of air) |
| 1 Monday | na | 0.3 |
| 2 Tuesday | 0.16 | 0.49 |
| 3 Wednesday | 0.22 | 0.61 |
| 4 Thursday | 0.14 | 0.49 |
| 5 Friday | 0.75 | 2.64 |
| 6 Saturday | 0.86 | 3.45 |
| 7 Sunday | 1.34 | 4.46 |
| 8 Monday | 1.34 | 4.46 |
| 9 Tuesday | 0.47 | 1.22 |
| 10 Wednesday | 0.47 | 1.22 |
| 11 Thursday | na | 0.4 |
(Note that the was only one measurement from 430 pm Saturday to 430 pm Monday and the same value has been assigned for these two days in the official records.)
To put these numbers in some comparable perspective, the average daily readings during December 1951 for smoke particles was 0.45 mg/m3.
At the time, that a major health problem existed was likely not apparent to most officials until the 8th or 9th when death numbers approached 900 per day.
Only after the event did the extent of the impact on human mortality become fully apparent. An analysis published in 1954 showed that when epidemiologists compared the registered number of weekly deaths to the average number over the five previous years for the same weeks, they found an increase in mortality during December that peaked at an estimated 3500 to 4000 excess deaths that were attributed to the smog. More recent research (Bell, et al, 2004) suggests the number likely reached 12,000 overall. As might be expected, the elderly and infants were highest among the death rolls. Some reports indicate, however, that those 65 years and older only accounted for two-thirds of the number. But the most surprising increase came in the death rate of middle-aged people (45-65), which tripled. (The infant mortality rate doubled.)
Almost all the deaths were attributed to cardio- and pulmonary impacts, particularly pneumonia, bronchitis, tuberculosis, and heart failure. Others suffering from preexisting conditions, including asthma, died of respiratory distress. Hundreds of thousands of other Londoners suffered from breathing difficulties, including short-term chest pains, lung inflammation and diminished breathing ability, damaged respiratory cells, permanent lung damage, and increased incidence of asthma attacks. Few escaped the sensual displeasures of the foul air.
This event was a watershed event in the field of air quality regulation at the time. Though deadly incidents would still occur, and poor air quality would continue to take hundreds of thousands of lives in less dramatic fashion, the London Killer Smog would change the attitude of governments and the public about general air pollution.
In Britain, another round of public inquiry into air quality would move toward stricter regulations in Britain and its cities. Two measures enacted in the 1950s reduced local air pollution with incentives for residential conversions away from open coal-fired heating and “dirty” coal. The two most important acts were the City of London (Various Powers) Act of 1954 and the Clean Air Act of 1956 with a further improvement of the Clean Air Act in 1968. Only once since 1952 (a decade later in December 1962) did Londoners face a major smog event, but its visible impact was not as great as the 1952 smog.
Some argue that the Great London Smog of 1952 was one of the sparks to the modern environmental movement which pushed legislation, engineering technology, and public health initiatives to new and more effective levels. Though it is true that air quality issues are still with us, there has been a wholesale shift in focus for areas of concern which becomes evident in the change in the usage and meaning of the word smog. No longer do most of us, on hearing the word smog, consider the combination of smoke and fog, but ascribe it to the photochemical mix that once only characterized Los Angeles.
Of course, I am thinking that with the release of new the Peter Jackson film based on Tolkien's The Hobbit, many will perhaps confuse smog with the dragon Smaug.
 |
Now AvailableThe Field Guide to Natural Phenomena: |
Now Available! Order Today! | |
 |
 |
Now |
The BC Weather Book: |