As I sat outside reading in the welcomed spring sunshine, a warm wind blew up the long valley of the Rocky Mountain Trench. It wasn’t long, however, before I needed to seek shelter from the wind as it threatened to forcefully turn the pages. Steady winds of moderate, or higher, speed are common here in Valemount as the village sits in the valley between two mountain ranges (Rocky Mountains, the Monashee/Cariboo Mountains) with a long southeast—northwest axis. This terrain influence alters the typical wind directions of passing highs and lows to conform to the terrain, giving us a very skewed wind rose.
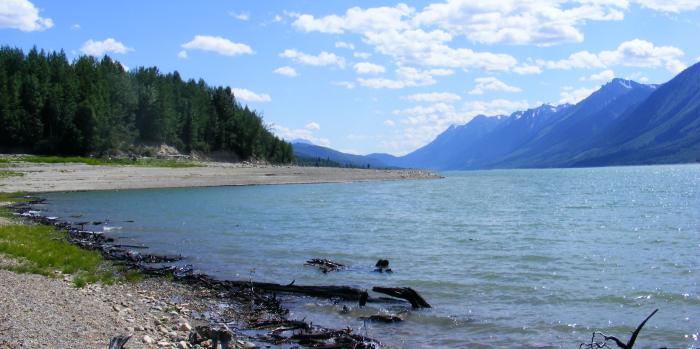
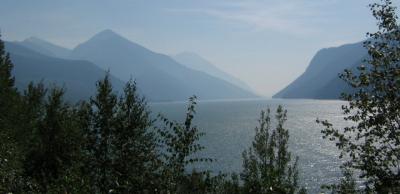
A while back, a good friend suggested we should place a wind farm in Kinbasket Lake. This lake forms some of the top stretches of the Columbia River, enlarged by the impoundment of waters by the Mica Dam in 1973. It is a long, narrow lake and is known for rough waters capable of swamping small boats and canoes. The long axis between the two ranges forces the winds along the valley and enhances their speed. In theory, it would make a great spot for a wind-generation operation.
Views Down Kinbasket Lake Looking South
Wind Generation
Those who promote wind energy know that, as in real estate, the prime factor for a wind-generated power facility is location. The prime criterion is that wind blows strong and steady. Gustiness should be at a minimum, making the smooth surface of lakes and seas ideal sites. Since the amount of energy available in the wind is cubically related to the speed at which it is moving (i.e., the energy is proportional to (speed)3), doubling the wind speed means an eight-fold increase in energy production. A good wind power site must therefore be consistently windy.
To be effective, a wind turbine should produce about 30 percent of its theoretical maximum output over the course of a year. Modern wind turbines should generate electricity about 80 percent of the time. We know, of course, that wind speed varies over the year, being typically stronger in winter and during the day, times when electrical power demand in generally highest.
Wind climatologies have been used to initially select areas where wind-generation may be considered viable. But most climate stations with wind sensors have not been sited in areas where wind speeds might blow strongest. Finding and assessing the best generation sites has led some climatologists known as wind prospectors to look for clues in the topography and vegetation for ideal wind turbines locations.
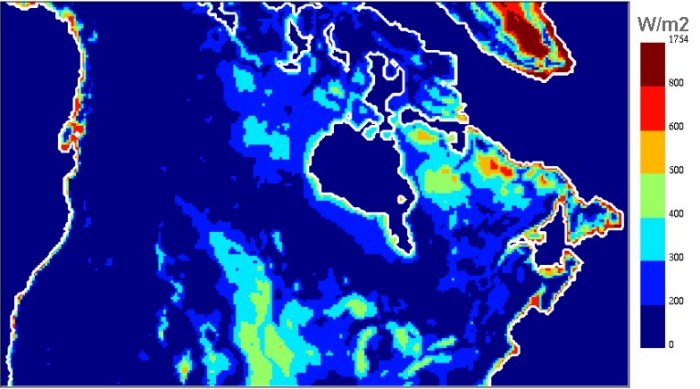
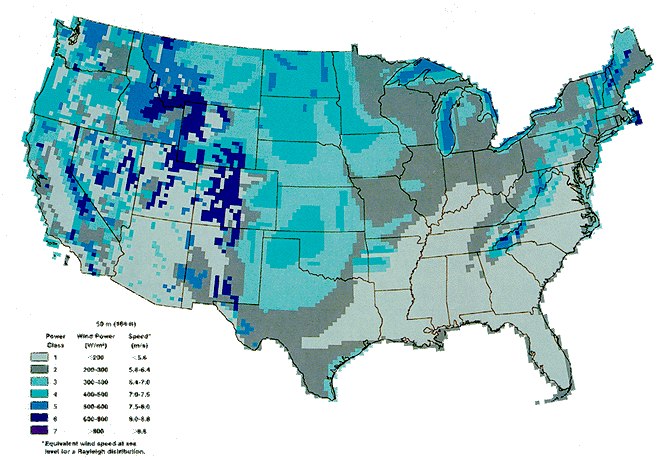
The maps given below show the wind climatology for the United States and Canada based on standard anemometer records. Such large scale maps give wind prospectors favorable locations in much the same way geological maps help oil and mineral prospectors.
Canadian Wind Power Distribution Courtesy Environment Canada
Annual average wind resource estimates in the contiguous United States
Courtesy U.S. Department of Energy
Wind Prospecting
The beginning of scientific wind prospecting came in the early 1970s at Oregon State University undertaken by one of my former professors E. Wendell Hewson. A number of energy utility groups in Oregon sponsored Hewson and his colleagues to find the best sites in the Pacific Northwest to located wind-generated electrical power systems, and Hewson understood he needed to look at locations in more detail than anemometer-based wind data studies could provide.
The art of wind prospecting focuses attention down onto the local and micro- scales to determine the best potential wind-generation sites. One who has been in the vanguard of wind prospecting since the early years is John Wade. He worked with Hewson to develop and verify criteria for the classification of long-term wind effects on trees as indicators of wind potential. For example, trees growing with its branches all on one side of the trunk (downwind side), a flagged tree, indicates persistent and strong winds.
While a strong prevailing direction is important, the annual wind-speed level is most critical. Light winds, say below 4 m/s, (9 mph), generally have little impact on growing trees, and this speed is about the lower operating threshold level for small wind turbines and below that required for the larger turbines. Winds greater than the safe upper operating limit for wind turbines, about 20 m/s (45 mph), may damage trees but usually do not have any molding effect on their shape.
Criteria developed by Griggs and Putnam around 1948 produced eight categories for tree shape deformation in response to wind speed. Hewson, Wade and R.W. Baker used these criteria to define annual average wind speed ranges to these categories for Douglas fir and Ponderosa pine.
If a tree has grown upright with a perfect shape, it fits into Class 0 or Class I, an indication of light winds (less than 4 m/s (10 mph)), and is of no interest to the wind prospector. Moderate flagging — trees having its largest branches bent away from the wind (Class III with winds at 5-6 m/s (11-13 mph)) — begin to draw interest. Complete flagging (Class IV) in which trees are desiccated and blown bare on one side will excite the prospector, particularly if the tree is a tough tree like a spruce or true fir. At this level, winds are prevailing at 6-7 m/s (13-16 mph). At the highest level Category VII, known as carpeting, the winds blowing at over 10 m/s (22 mph) have bent the trees nearly completely horizontal so that they resemble bushes more than trees.
There are other methods of prospecting using trees. One is based on the deformation ratio, which is calculated by measuring the degree of trunk bend from vertical and is related to the annual wind speed by the Ponce-Mattio formula. Another, the compression ratio, is based on the wind’s influence on the growth pattern of the tree’s rings. Reaction wood forms in response to a continual wind force on the tree and has an abnormal structure when compared to unaffected trees. In softwoods (conifers), it is termed compression wood and forms on the leeward (downwind) side of the trunk. In hardwoods, it is termed tension wood, which forms on the windward (upwind) side of the trunk. The ratio is determined by measuring the ring widths, usually the last five years of ring growth, on the leeward and windward sides of the trunk. The ratio for softwoods is the ratio of leeward to windward growth, and for hardwoods, the inverse. This ratio can be related to the annual wind speed by a linear relationship.
Other factors of use in wind prospecting include the types of vegetation cover, the topography of sand dunes, and locales with snow sweep or sand scouring patterns. More recently, satellite imagery and computer models have been used to find potential wind-generation sites.
Wind Energy Production
Wind power has been used for many millennia to move boats, ventilate buildings, pump water and mill grains. (For more on early use of wind power, see Windmills.) The first successful attempts to generate electricity by wind capture came in the late1800s. In the 1930s, before large-scale electricity became available to rural areas across Canada and the United States, more than 600,000 windmills produced electricity and pumped water on farms. The Danes, who had established the first major wind generating system for electricity in the post World War I period, began the modern wind power industry in 1979. Today, Denmark generates nearly 20 percent of its electricity through wind turbines — the highest percentage of any country and has the goal to reach 50 percent by 2030.
Presently, wind power is among the fastest growing new sources of electricity in the world, increasing by around 24 percent a year over the past decade. At the end of 2009, worldwide capacity of wind-powered generators was 159.2 gigawatts (GW). Energy production stood at 340 terrawatt-hours (TWh), about two percent of global electricity usage. A number of nations have reached significant levels of electrical generation by wind power: 19 percent in Denmark, 13 percent in Spain and Portugal, and 7 percent in Germany and Ireland. As of May 2009, eighty countries around the world had wind-generated power available on a commercial basis. The United States, India, Germany, Spain, and China have made great advances in increased wind power capacity over the last few years.
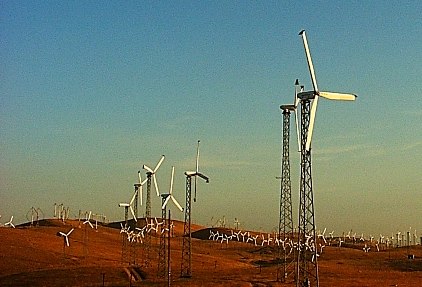
Some of the over 4000 wind turbines at Altamont Pass, in California. Photo taken by Xah lee, Source: English Wikipedia
In 2009, the United States was only surpassed by the combined European Union (just under 75,000 MW) in total wind power capacity, at around 35,000 MW, though it provided less than 2 percent of power demand. Germany was next with over 25,000 MW. China also exceeded 25,000 MW of production capacity. Spain and India rounded out the top five, with both over 10,000 MW. The second five were all European nations: in order, Italy, France, the United Kingdom, Portugal and Denmark with between 3,500 and 5,000 MW. Canada is ranked 11th at 3,300 MW.
While large-scale wind farms account for much of this production, smaller production units have also been installed, particularly in countries with remote areas of low population density such as the United States and Canada. Many of these small installations provide electricity for a single or small number of users, like a farm, ranch or lighthouse.
Wind-power generating complexes will continue to be installed around the globe as more nations look toward renewable sources of electrical generation. New technologies and increased efficiency of wind and other renewable sources will push efforts down to smaller scale production units that can relieve remote areas and installations of the need for expensive fuels and transmission lines.
Learn More About Wind From These Relevant Books Chosen by The Weather Doctor
For More Weather Doctor articles, go to our Site Map.
I have recently added many of my lifetime collection of photographs and art works to an on-line shop where you can purchase notecards, posters, and greeting cards, etc. of my best images.


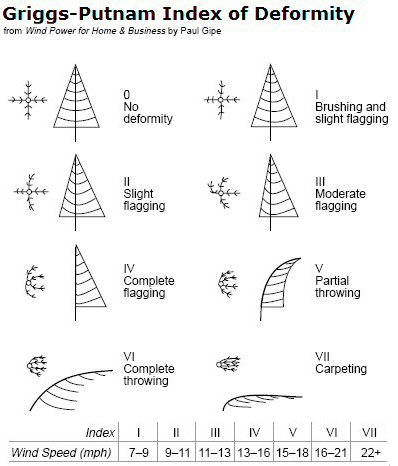 Criteria developed by Griggs and Putnam around 1948 produced eight categories for tree shape deformation in response to wind speed. Hewson, Wade and R.W. Baker used these criteria to define annual average wind speed ranges to these categories for Douglas fir and Ponderosa pine.