| Home | Welcome | What's New | Site Map | Glossary | Weather Doctor Amazon Store | Book Store | Accolades | Email Us |
 | |||||||||||||
Weather Almanac for December 2009THE CONVEYOR BELTS:
|
|||||||||||||
 |
 |
Equation for Potential Temperature |
Equation for Equivalent Potential Temperature |
[Note too that this conceptual model is not the same as another “conveyor” model that arose around the same time through the work of Dr Wally Broecker. This model looks at how ocean currents, at the surface and at depth, transport heat around the global ocean basins and play a major role in the climate of the surrounding continents. This conveyor concept has received some press of late because its application to the North Atlantic Ocean raises the question as to whether global warming, or more particularly arctic warming, could change the ocean circulation of the North Atlantic Ocean in a way that would plunge Europe into a cold climate period. I won’t go further here, but it is an interesting model for our understanding of ocean-atmosphere dynamics.]
The conveyor belt cyclone model extends the Bergen cyclone model to include interactions through the whole atmosphere rather than just the surface layer. Getting technical for a moment, these interactions take place on isentropic surfaces, which are features of a weather analysis depicting constant values of potential or equivalent potential temperature. The isentropes (lines of equal isentropic values) slope vertically against the isobars (lines of equal pressure).
In isentropic analysis, it is assumed that the air flows more or less horizontally along the isentropic surface characteristic of its potential temperature (or equivalent temperature). Isentropic temperatures are deformed to slope upward by cold air and downward by warm air. Isentropic analysis is displayed as a vertical cross section between two geographic points or as a horizontal plot of isolines of equal potential temperature.
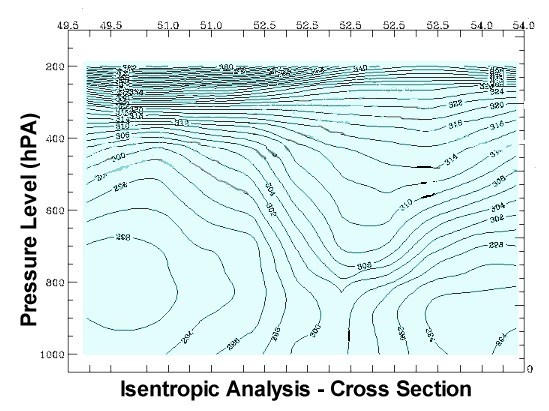
A parcel of air moves along the isentropic surface like a car moves along the highway, ascending for higher terrain and descending for lower. In this case, higher means cold air and lower, warm air. As a result, we can infer the vertical motion of a parcel from such changes in the isentropic surface topography. The conveyors are thus representations of the movements of air that transfer heat and moisture from one altitude level to another through a cyclonic system. Normally, when the isentropic flow is towards low pressure, ascent, or lift, is indicated. And when the isentropic flow is towards high pressure, descent, or subsidence, is indicated.
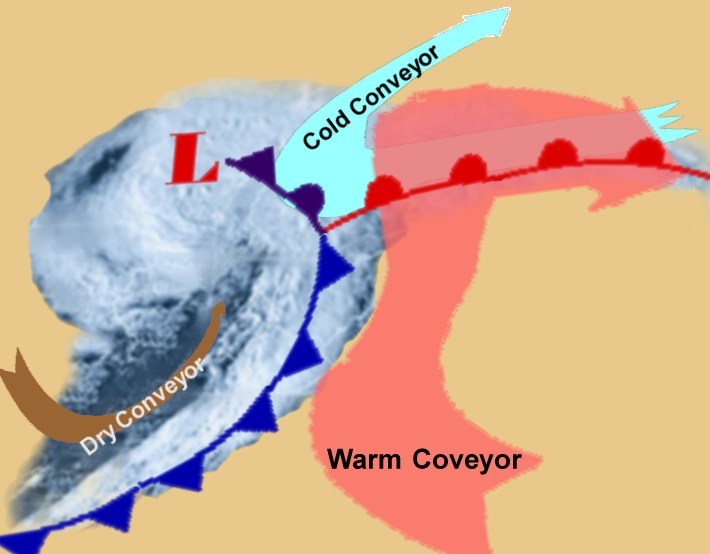
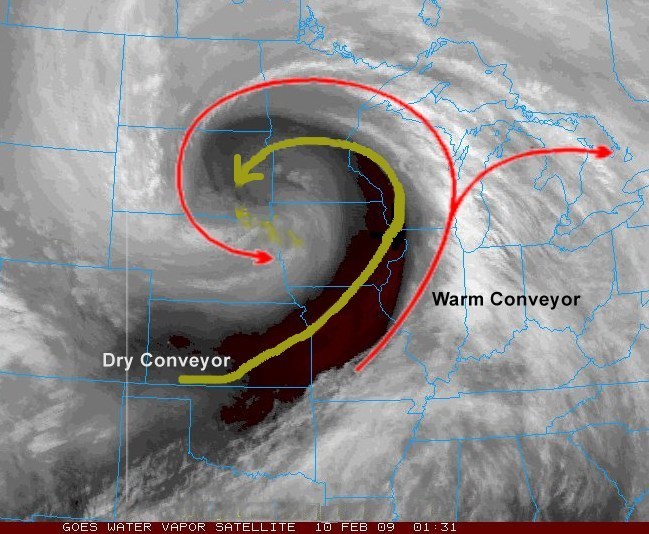
The conveyor belt cyclone model has three main components: the warm conveyor, the cold conveyor and the dry conveyor or dry airstream. In simplest terms, the warm conveyor is the warm, moist air being transported northward that is lifted at the warm front. The cold conveyor flows parallel to the warm front on the cold-air side toward the center of low pressure. The dry conveyor brings the drier, descending air found behind the surface cold front. The flows of air making up these conveyors are important for understanding the distribution of clouds and precipitation around a cyclonic storm system. As mentioned above, the cold front deals with the interaction of the warm conveyor and the dry conveyor, the warm front concerns interactions of the warm and cold conveyors, and the occluded front includes influences from all three.
The warm conveyor corresponds to the main injection of warm, moist air that feeds the midlatitude cyclone. It flows poleward in the cyclone’s warm sector parallel to the cold front. As the warm conveyor approaches the warm front, it begins to ascend. The area with the strongest ascending motions over the warm front will be found in the area of strongest warm air advection. As this air ascends as it moves away from the cyclonic center, it forms the characteristic cloud sequence of an approaching cyclone/warm front with high cirrus in the lead followed by the alto-forms and finally the lower stratus and nimbostratus decks.
In the early development stage of a wave cyclone, the warm conveyor belt ascends within the cloud band at both the cold and warm front. It then turns anticyclonically (eastward in the Northern Hemisphere) to flow parallel to the surface warm front. The warm conveyor eventually rises to join the jet level flow in the upper troposphere.
As the cyclone enters the occlusion stage in its later life cycle, some of the warm conveyor may turn cyclonically around the low center. This portion of the warm conveyor creates a trough of warm air aloft, known as a trowal (for trough of warm air aloft), that resembles a sloping canyon with warm ascending air in the center and cooler air on both sides. As the trowal, which begins at the point where the warm and cold fronts meet, ascends above the surface occluded front, it often becomes an area of precipitation distinct from the warm frontal sector.
The amount of precipitation associated with the cyclone depends upon the amount of moisture flowing into the circulation with the warm conveyor. The heaviest precipitation will generally be found in the moistest and most rapidly rising sectors of the warm conveyor.
Unlike the warm and cold conveyors, the dry conveyor originates at altitude (from the high troposphere/low stratosphere) and descends behind the cold front moving equatorward. This conveyor is a relatively deep layer of low relative humidity. As it descends west of the upper level trough associated with the surface low, it can spread out sending some air up and over the warm/occluded fronts and some behind the surface cold front where it does a rollercoaster-like dip before re-ascending to join the westerly flow aloft after rising above both the warm and cold conveyors. The dry conveyor is important for maintaining a strong temperature contrast across the cold front.
It does not cross the warm conveyor at cloud level, but may do so above or below cloud level. When it crosses above the warm conveyor, a potentially unstable situation develops that can cause produce convective cells that vertically mix the air masses and lead to convective precipitation events, which may be severe if conditions are right. If they are not, it can produce a region of clearing behind the cold front that is cloud free and may give the impression on the ground that the precipitation from this storm has ended. Lee Grenci and Jon Nese, in their text World of Weather, call this a “fool’s clearing.”
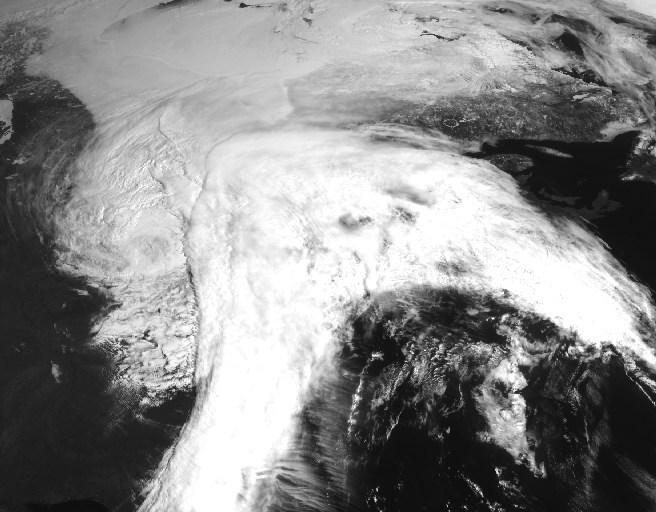
When the dry conveyor turns eastward and then northward into the center of the cyclone, its dryness can clear out the clouds near the low center and form a dry, cloud-free sector that gives the storm a comma-shape cloud pattern as seen from satellite images. This sector is particularly pronounced in satellite sensing using the water-vapor wavelengths; the resulting images show the dark band (low humidity) of the dry conveyor between head and tail of comma.
The cold conveyor can be found north of the warm front, along in the general path of the mature storm system originating in the colder air poleward and east of the cyclone’s low pressure center. The cold air initially streams westward below the warm conveyor belt near the surface toward the surface low where it then ascends at the apex of the warm and cold fronts, eventually turning clockwise (eastward in the Northern Hemisphere) to become part of the westerly upper air flow. The cold conveyor belt transfers air from the cold sector ahead of the surface warm front into the cyclone.
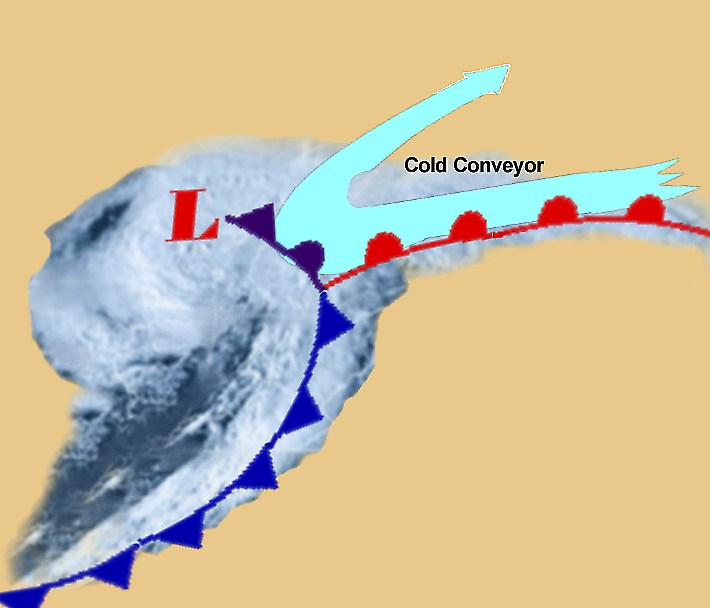
The cold conveyor will pick up moisture from the precipitation falling from the warm conveyor above it, and may it become saturated as it rises north of the low center. The character (temperature and humidity) of the air within the cold conveyor can control the amount and type of precipitation falling to the surface around the warm front. If the cold conveyor belt contains a shallow layer of subfreezing air, sleet and/or freezing rain may occur. However, low-level cooling in the cold conveyor belt through the melting of snowflakes may cause rain to change to heavy snow. If the cold conveyor is relatively dry, evaporation/sublimation of falling precipitation will reduce the amount and intensity of precipitation reaching the ground. Visually, this can be seen as virga. However, if the cold conveyor is near saturation, there is little evaporation, and the precipitation reaching the ground may be heavy.
When the cyclone system has matured and entered the occlusion stage, the conveyors interact near the point of the occlusion. How they interact determines the type of occlusion and the associated weather. Whether a warm conveyor occlusion type or a cold conveyor occlusion forms likely depends on the stage of development of the cyclone. If the height field in the mid- and upper levels of the troposphere displays a closed cyclonic circulation, the occlusion will likely be of a warm conveyor-type of occlusion characterized by multilevel cloudiness.
In the warm conveyor occlusion, the cold conveyor moves parallel to the surface warm front toward the low pressure center and rises at the point of occlusion, penetrating the warm conveyor from below and turning cyclonically as it rises. The cold conveyor forms the main occlusion cloud band. This band is generally hidden below the higher level clouds that form in the warm and dry conveyors above. As the conveyor turns cyclonically, its ascent ends and changes to a descending motion. The warm conveyor has split in this later stage with one branch still cloud band of the warm front and the other the other branch flows westward into the cloud spiral of the occlusion. The two conveyors will often form multilevel occlusion cloud bands, which are distinctly different, a combination of warm frontal, cold frontal and warm conveyor clouds.
The dry conveyor moves toward the low center and abruptly turns cyclonically (counterclockwise). The dry air may form a large cloud void within the cloud deck forming the distinctive comma structure of mature storms in their later stages.
The rise of the conveyor model shows how scientists are able to improve on the understanding of natural systems when direct observations increase and the tools for analysis such as computer power become more powerful. For me, it reminds us that we should not be so fixed upon previous theories as to close the door on improvements. It also shows that the atmosphere remains a complex system in which variations of conditions from simple descriptions are frequent.
 |
To Purchase Notecard, |
Now Available! Order Today! | |
 |
 |
Now |
The BC Weather Book: |


 When the