Weather Almanac for January 2008
THE GREAT ICE STORM OF 1998

|
When 1998 began, a strong El Niño still held on in the Pacific Ocean, and it seemed everything happening across North America was blamed on its presence. In response to the negative attitude to the weather that year, I was preparing a new website focused on the weather. Little did I know as I composed an article on ice storms that Mother Nature was preparing an icy blow to eastern Canada and the northeastern United States that will stand as a landmark ice storm for decades to come. We in Canada refer to it as the "Quebec ice storm" as that province took the brunt of its devastation. Weather systems do not respect national boundaries, however, and areas of New York State and New England south of Quebec had similar storm impacts.
Ice storms, in my opinion, sit near the top of the list for weather events that show how vulnerable our society and infrastructure are to natural disruptions. A small ice storm can make transportation slow to a crawl, whether by aircraft, automobile or train, and may stop it altogether. Ice storms also wreak havoc on power and telephone lines, and can render a region powerless for hours to weeks. In addition, the weight of accumulated ice, damages buildings and trees, often compounding the problems for transportation and powerlines. A major ice storm, like the one that struck last month (December 2007) from Oklahoma to northern Illinois, quickly makes travel a hazard and cuts power off to hundreds of thousands.
The ice storm that brought Quebec and surrounding areas to a standstill could only be called a superstorm. Briefly, its impacts over the five days it rained ice on the region included 46 deaths, billions of dollars in damage, and more than four million people without electrical power, some for as long as five weeks. The storm affected millions of people directly, and had impacts on millions more through its effects on business and agriculture. In Quebec alone, an estimated 32,000 kilometres (20,000 miles) of power transmission lines came down alone with 1300 large transmission towers and 30,000 wooden utility poles. Perhaps the only other storm to strike North America with an impact of the same magnitude in recent memory was Hurricane Katrina.
The Weather Situation
In 1997-98, a mature El Niño in the Pacific had influenced the weather conditions across the North American continent since June 1997. A strong sub-tropical jet stream across the southern US increased the storminess along the US Gulf Coast at the turn of the year. Days prior to the onset of freezing rain in Quebec and surrounding land areas, warm, moist air flowed from the Gulf into southern Ontario and Quebec and western New York ahead of a low pressure system lying over north Texas. Off the US east coast, a large high pressure cell sat over Bermuda and blocked the normal pathway of the southern storm track like a traffic island and diverted the moist air northward up the western flank of the Appalachian Mountains. During the coming week, heavy rains caused unusual winter flooding in several American states from Tennessee northward and into southwestern Ontario. Most of the Canadian Maritime provinces received heavy snow.
(For details on how an ice storm forms, see my article: Ice Storms: Hazardous Beauty.)
|
This month is also the tenth anniversary of the first posting of The Weather Doctor.
I had begun preparing the concept in late 1997 spurred by the media's over-zealous blaming of nearly everything bad on the prevailing El Niño. I originally intended to launch the site on 2 February, Groundhog Day, but one event of that January changed my mind.
In looking through my collection of previously written articles to see what might fit for the first articles to post, I came across an article I had written for Nature Canada decades before on ice storms. When I wrote that article, I had a good set of slides taken in an ice storm in Guelph Ontario in 1972, but the editors chose to use their own illustrations for the piece. So I had the base materials for the first main article in the Weather Phenomenon and Elements section. The first Weather Almanac entry was on Groundhog Day since that was my intended launch date.
But when I heard the unfolding saga of the ice storm devastating Quebec and New England, I knew that many would be searching the internet to learn more about ice storms, and that my article could provide that information. Thus, I rushed the launch ahead a few weeks. Now ten years later, I revisit that event.
1998 was to be a significant weather year. The January ice storm would begin it. In the autumn, Hurricanes Georges and Mitch savaged the Carribean region. In September, Hurricane Georges left a trail of destruction across the Caribbean and the southern US Gulf coast. In November, Hurricane Mitch struck Central America leaving a death toll reported as 11,000, the most deadly hurricane to strike the Western Hemisphere in the last two centuries.
For me, the year not only saw the birth of The Weather Doctor but also the birth of my first grandson a few weeks later (just missing Groundhog Day by one day). Both are doing well a decade later, and I look forward to many more happy years with them.
|
The kicker in this January weather situation was a large arctic air mass whose center of high pressure lay over Hudson Bay and Labrador. This cell pumped very cold air out of Canada's North into the St Lawrence and Ottawa river valleys. The heavy cold air settled stubbornly in the valleys and over sections of northern New York State, Vermont, New Hampshire and Maine, and forced the warm, moist Gulf air to flow over it — the perfect scenario for a major ice storm in this region.
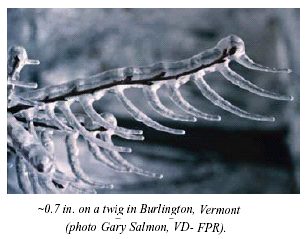
Along the semi-stationary front that developed between the warm, moist air and the cold, several weak cells of low pressure moved across the region initiating precipitation from the warm air aloft. In the warm wedge of air well above the ground, rain began falling on 5 January across much of the region. As the rain fell through the cold air below, whose depth was sufficient to supercool the rain but not to freeze it into ice pellets, it became freezing rain and began accumulating on every available surface.
 |
 |
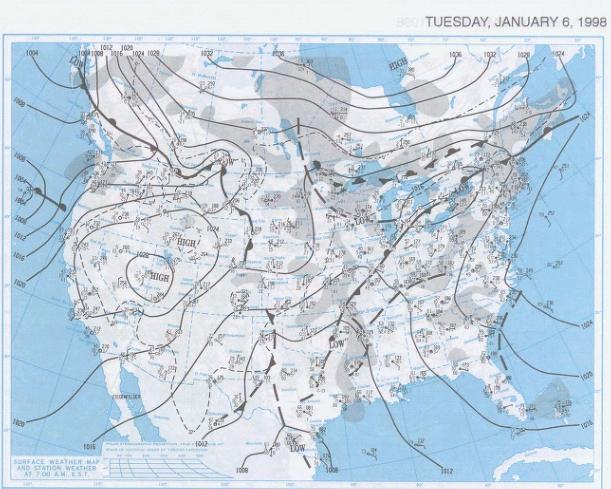 |
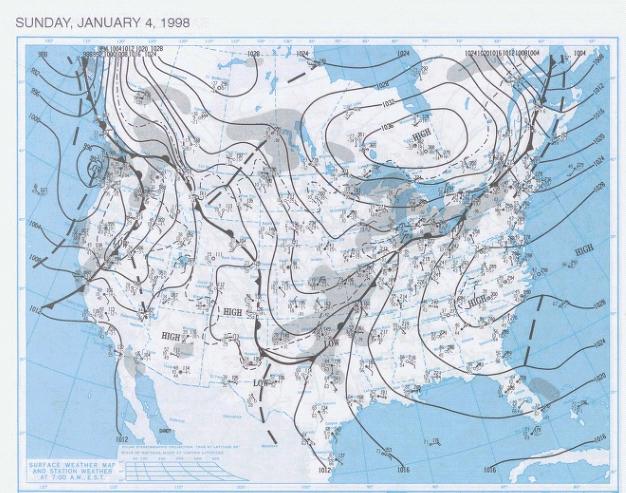
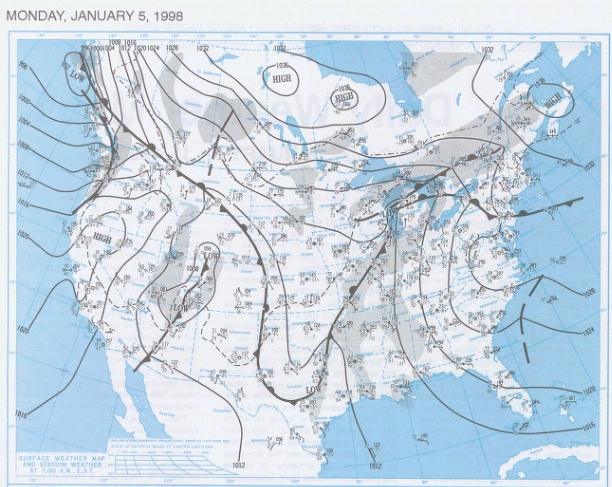
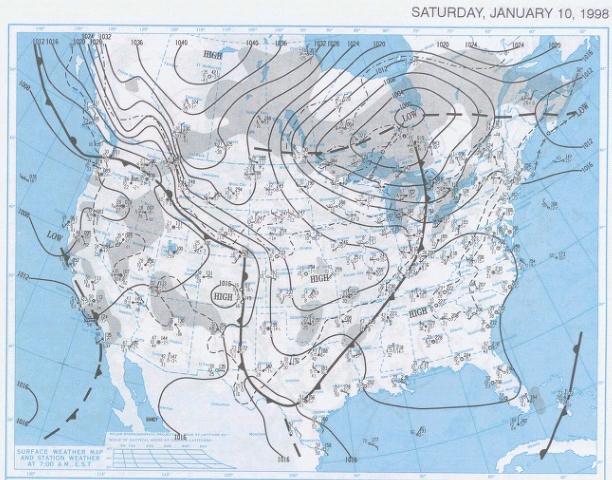
Daily Surface Weather Map for 4-6 January 1998 (0700 EST)
for larger image, click on map |
The cold air mass did not relinquish its grip on the region until late on 9 January in eastern Ontario and the freezing rains did not cease until 10 January across the rest of the region. At the storm's peak, the area reporting freezing precipitation extended from Kitchener in southwestern Ontario and Muskoka in south central Ontario through southeastern Ontario, southwestern Quebec and the Eastern Townships to the Fundy coasts of New Brunswick and Nova Scotia. In the United States, icing coated northern New York and most of upper New England away from the coast.
 |
 |
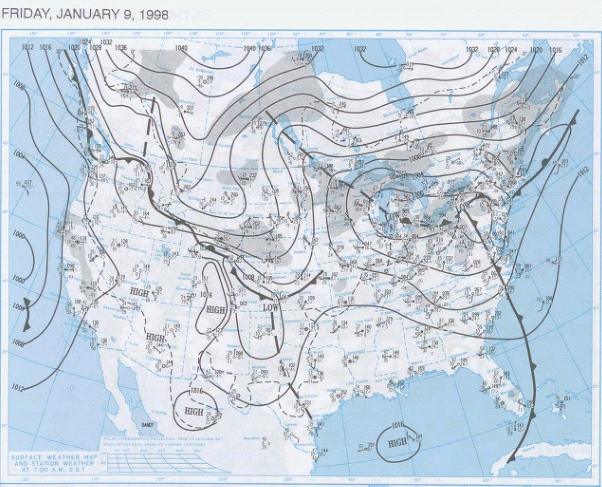 |
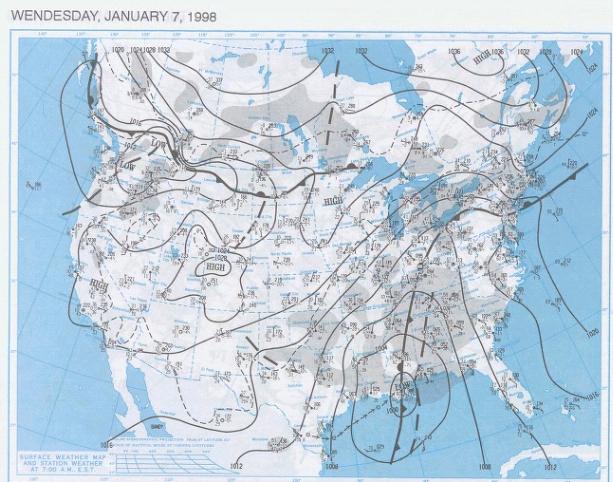
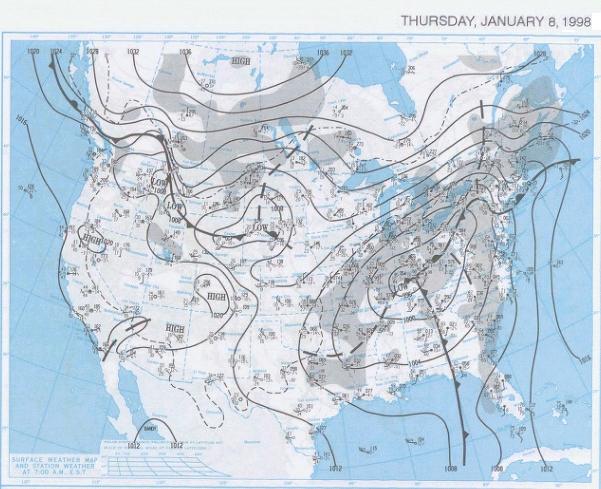
Daily Surface Weather Map for 7-9 January 1998 (0700 EST)
for larger image, click on map |
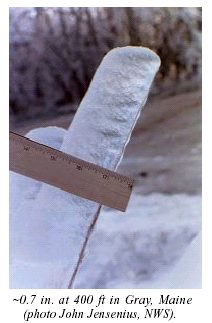
During the period 5-10 January, observations of freezing rain and drizzle in Quebec exceeded 80 hours, nearly double total average annual number of hours of freezing precipitation. The total accumulation of water equivalent of freezing precipitation, mixed at times with light snow and ice pellets, exceeded 85 mm (3.3 inches) in Ottawa, 73 mm (2.9 inches) in Kingston, 108 mm (4.3 inches) in Cornwall and 100 mm (3.9 inches) in Montreal, amounts of ice accumulation nearly twice the accumulation in notable ice storms that hit the Ottawa area in 1986 and Montreal in 1961. The thickness of ice accumulated reached 120 mm (4.7 inches) in places. Across northern New York and Vermont freezing rain accumulation reached 51 to 100.2 mm (2-4 inches) thick, and most of central Maine saw about 25-50 mm (1-2 inches) of freezing rain.
Ahead of the ice storm, heavy sleet and snow fell in many areas of New England. Central Maine received up to 250 mm(10 inches) of sleet, and over 60 cm (2 ft) of snow accumulated in northern Maine. Behind the storm, south of the front in the warmer air mass, heavy rains fell, with over two inches of rain in northern New York State and upwards of 75-100 mm (3-4 inches) of rain recorded in the Tug Hill Plateau region of New York State. The 7-9 January rainfall registered as the most in recorded history across western and central New York for this time of year. The entire region received between 63.5 and 101.6 mm (2.5-4 inches) over a 48-hour period.
 |
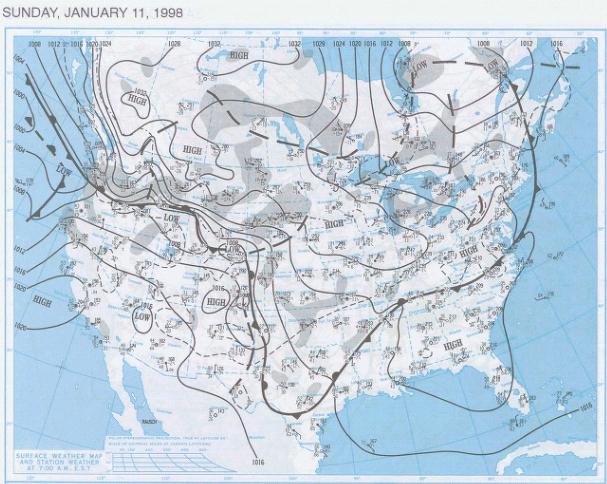 |
Daily Surface Weather Map for 10-11 January 1998 (0700 EST)
for larger image, click on map |
A dry cold front pushed across the area on 10-11 January, followed by another frontal wedge on the 13th. Behind its cold front, winds became strong and gusty from the west to northwest. Recorded gusts generally registered in the 50-65 km/h (30-40 mph) range, but some blew stronger. The net result was more damage to trees and power lines still laden with ice. The post storm trauma was exacerbated by a steep drop in temperature that immediately followed the initial. To further complicate recovery efforts, the weather continued unsettled until the last week of January with some areas receiving more sleet and freezing rain over 23-24 January.
The Impacts
 That much ice accumulation brought devastation to the region's infrastructure, wildlife, and residents over the period from 5 to 13 January. The area of the storm receiving more 40 mm (1.6 inches) or more of ice held 18% of Canada's population — 56% of Quebeckers and 11% of Ontarians. It also accounted for 19% of all Canadian urban lands, 57% in Quebec and 19% in Ontario. At the height of the ice storm, 57 Ontario communities and 200 in Quebec declared a disaster situation. On 8 January, the Canadian government declared a state of emergency and called in the military to help clear debris, assist in restoring power, provide medical assistance, evacuate residents, and canvass door-to-door to make sure others were safe. The Canadian Forces deployed nearly 16,000 troops in Operation Recuperation, the largest-ever peacetime military deployment. In addition, 6,200 Canadian Forces members and Department of National Defence employees worked at their regular jobs to provide the logistical support required for the operation. In the United States, President Clinton called the National Guard to duty in the affected area and declared a number of counties in Maine (16), New Hampshire (9), New York (6), and Vermont (6) federal disaster areas. That much ice accumulation brought devastation to the region's infrastructure, wildlife, and residents over the period from 5 to 13 January. The area of the storm receiving more 40 mm (1.6 inches) or more of ice held 18% of Canada's population — 56% of Quebeckers and 11% of Ontarians. It also accounted for 19% of all Canadian urban lands, 57% in Quebec and 19% in Ontario. At the height of the ice storm, 57 Ontario communities and 200 in Quebec declared a disaster situation. On 8 January, the Canadian government declared a state of emergency and called in the military to help clear debris, assist in restoring power, provide medical assistance, evacuate residents, and canvass door-to-door to make sure others were safe. The Canadian Forces deployed nearly 16,000 troops in Operation Recuperation, the largest-ever peacetime military deployment. In addition, 6,200 Canadian Forces members and Department of National Defence employees worked at their regular jobs to provide the logistical support required for the operation. In the United States, President Clinton called the National Guard to duty in the affected area and declared a number of counties in Maine (16), New Hampshire (9), New York (6), and Vermont (6) federal disaster areas.
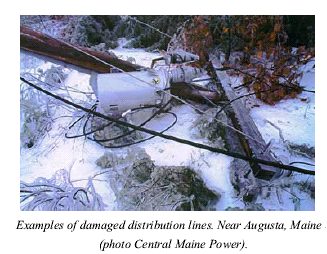
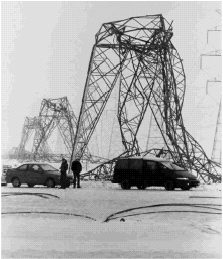 The greatest visible impact to those affected struck the power delivery systems throughout the region. The large electrical transmission towers that brought power to local communities fell as easily as the power poles that delivered the services to the residents. In Quebec alone, an estimated 1000 transmission towers (pictured on left, courtesy Quebec Hydro), and 35,000 wooden utility poles fell or were twisted beyond recognition by the heavy ice and following winds. An additional 300 transmission towers were downed in Ontario. Of those 1300 transmission towers, many were large 735-kilovolt transmission towers worth $C 100,000 each. Quebec Hydro estimated 32,000 kilometres (20,000 miles) of transmission lines and 96,000 kilometres (60,000 miles) of distribution lines were brought down by the storm. Over a million households in Canada lost power, some for over a month. In the US, the estimates from New York State, Vermont, New Hampshire and Maine were of the same order, in excess of a million household affected. The greatest visible impact to those affected struck the power delivery systems throughout the region. The large electrical transmission towers that brought power to local communities fell as easily as the power poles that delivered the services to the residents. In Quebec alone, an estimated 1000 transmission towers (pictured on left, courtesy Quebec Hydro), and 35,000 wooden utility poles fell or were twisted beyond recognition by the heavy ice and following winds. An additional 300 transmission towers were downed in Ontario. Of those 1300 transmission towers, many were large 735-kilovolt transmission towers worth $C 100,000 each. Quebec Hydro estimated 32,000 kilometres (20,000 miles) of transmission lines and 96,000 kilometres (60,000 miles) of distribution lines were brought down by the storm. Over a million households in Canada lost power, some for over a month. In the US, the estimates from New York State, Vermont, New Hampshire and Maine were of the same order, in excess of a million household affected.
 |
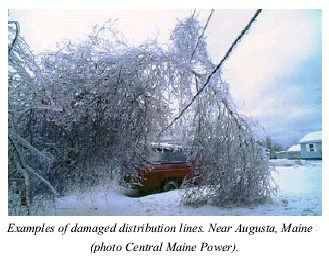 |
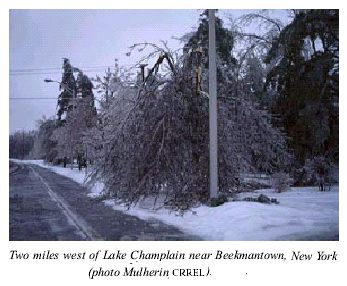
The storm also downed millions of trees across the region; some of them took transmission lines with them, others blocked road and damaged vehicles, homes and other buildings. In the US, officials compared the level of tree damage sustained to the great 1938 hurricane that struck New England. The ice storm affected 17 million acres of forest across northern New York, Vermont, New Hampshire, and Maine, including parts of the Green Mountain National Forest and the White Mountain National Forest.
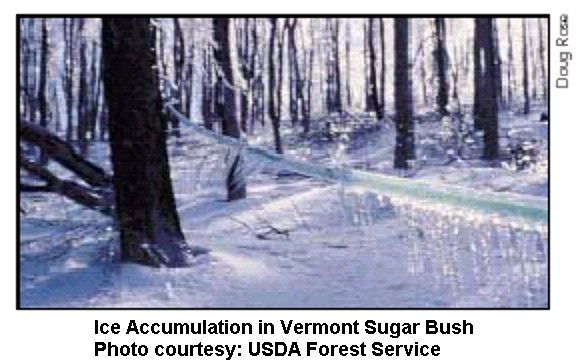
But the biggest blow was dealt to the Canadian maple sugar industry which produces seventy percent of the world's supply, particularly in Quebec. Over 22% of all Canadian maple syrup-producing trees bore the weight the thick ice. In addition to trees severely damaged by the ice, millions of branches broke under the ice, and the falling branches and ice accumulation damaged many of the pipes in domestic groves that channel the sap to the collection facilities. Following the storm, the Ontario Maple Syrup Producers Association estimated it could take up to 40 years for eastern Ontario's production to return to normal.
In addition to the loss of commercial trees, ornamental trees across the region took a heavy hit. In Montreal's Mount Royal Park, city work crews had to cut down 5,000 trees too severely damaged to be saved, and eighty percent (140,000) of the remaining trees were damaged to varying degrees and had to be trimmed. Observers commented that the park looked like a logging camp. In Kingston, Ontario, Manager of Parks, Mark Fluhrer remarked: "We were just plowing, literally plowing trees off the streets. It was incredible." In eastern Ontario, the quantity of wood chips that the Ontario Ministry of Transport estimated they had to dispose of amounted to one half-million cubic metres, enough to cover the multilane Highway 401 from the middle of Toronto to the Quebec border (around 500 km (300 miles) in length) to a depth of five cm (two inches).
Despite the fact it was winter, the local agricultural industry lost millions of dollars in property and revenue due to the storm. Hardest hit were the dairy and livestock industries. Many barns collapsed under the ice and killed the animals trapped within. Other livestock loses resulted from the loss of electrical power to the barns, cutting off water supplies, heating and ventilation. In the Canadian diary industry, the loss of power meant thousands of cows (nearly a quarter of Canada's milk cow herd) could not be milked, making them vulnerable to mastitis, an inflammation of the udder. Despite aid provided by Mennonite communities in Ontario and elsewhere of experienced hand-milkers to dairy farmers, many cows were unable to be milked. Some responded poorly to the hand-milking, having been milked by machine their whole lives. Where milking was undertaken, by hand or using emergency power generators, the milk could not be properly stored nor delivered to the dairies and thus spoiled. About 10 million litres (2.6 million gallons) of milk were dumped at a value of $5-6 million Canadian.
 The loss of power and resultant loss of water supply across the region forced many from their unheated homes. Fuel for heating and transportation was in short supply as existing reserves could not be pumped due to lack of electrical power. Many businesses and industrial plants shut down due to lack of electricity or for the safety of their workers. In Canada, an estimated 100,000 people relocated to shelters, and millions more travelled to friends and relatives for meals, shelter, and a shower. In the US, over 12,000 evacuated their homes to one of the three hundred shelters set up. Hypothermia and toxic fumes from heating devices ranked high on the list of storm-caused injury and death. Officially, 28 died in Canada as a result of the storm with 16 deaths in the US. The loss of power and resultant loss of water supply across the region forced many from their unheated homes. Fuel for heating and transportation was in short supply as existing reserves could not be pumped due to lack of electrical power. Many businesses and industrial plants shut down due to lack of electricity or for the safety of their workers. In Canada, an estimated 100,000 people relocated to shelters, and millions more travelled to friends and relatives for meals, shelter, and a shower. In the US, over 12,000 evacuated their homes to one of the three hundred shelters set up. Hypothermia and toxic fumes from heating devices ranked high on the list of storm-caused injury and death. Officially, 28 died in Canada as a result of the storm with 16 deaths in the US.
The stories of those who weathered this storm would fill several volumes. The Canadian stories have been compiled and presented to us ably, by Mark Abley in his two books: Stories from the Ice Storm and the photograph collection The Ice Storm: An Historic Record in Photographs of January 1998 . Many of the stories therein tell of ordinary people confronted with extraordinary times and circumstances. What struck me most in the incidents presented in these books and in the retrospective reports is the vulnerability of our daily lives when access to electrical power is cut off for more than a few hours. And many of the impacts of the loss of power I had never contemplated before, such as those regarding the dairy industry.
After the Storm
The full cost of the storm in the two nations may never be fully accounted. Initial Canadian losses (in Canadian dollars) were pegged at $3 billion in lost income to businesses, $1 billion in hydroelectric infrastructure repairs, $1 billion in Provincial governmental expenses, $1 billion in insurance claims, and millions of dollars for Federal military costs. Damages in the US may have reached $US 2 billion.
Learn More From These Relevant Books
Chosen by The Weather Doctor
Written by
Keith C. Heidorn, PhD, THE WEATHER DOCTOR,
January 1, 2008
The Weather Doctor's Weather Almanac: The Great Ice Storm of 1998
©2008, Keith C. Heidorn, PhD. All Rights Reserved.
Correspondence may be sent via email to: see@islandnet.com.
Daily weather maps courtesy the NOAA Central Library Data Imaging Project.
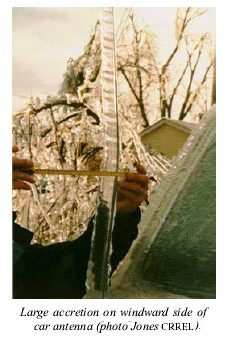
CRREL photos, courtesy US Army Cold Regions Research and Engineering Laboratory
For More Weather Doctor articles, go to our Site Map.
I have recently added many of my lifetime collection of photographs and art works to an on-line shop where you can purchase notecards, posters, and greeting cards, etc. of my best images.
Now Available! Order Today! |
 |
 |
|
|
Home |
Welcome |
What's New |
Site Map |
Glossary |
Weather Doctor Amazon Store |
Book Store |
Accolades |
Email Us
|


|