| Home | Welcome | What's New | Site Map | Glossary | Weather Doctor Amazon Store | Book Store | Accolades | Email Us |
 | |||||||||||||||||||||
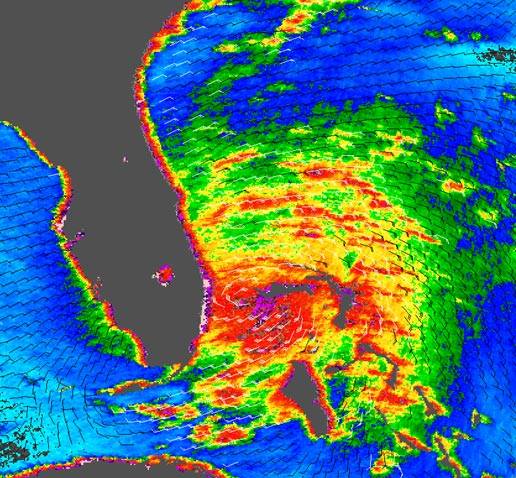
WEATHER SATELLITES AND TROPICAL STORMSMore Than Cloud Imagery SidebarAs remote sensing technology has advanced with more and more detailed observations, the abilities of meteorological satellites to view the weather has moved from simple visible light images to sophisticated tools that allow “seeing” through clouds and in situ details of storm anatomy. 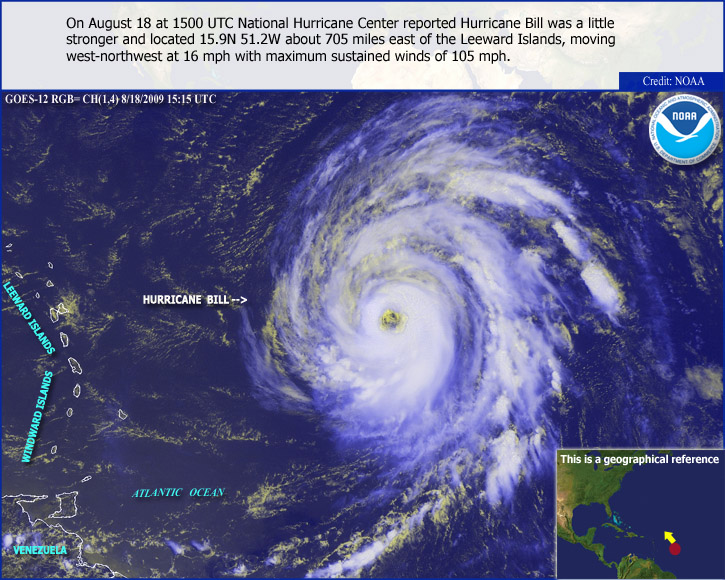 Dvorak TechniqueHowever, before weather satellites moved beyond the polar orbiting satellites with only visible and infrared imaging capabilities, one important early tool in the analysis of tropical storms was developed by Vernon Dvorak in 1974. Dvorak realized that tropical storms of similar intensity have certain characteristic features. Furthermore, as they strengthen, they tend to change in appearance in a predictable manner. He used these tendencies to subjectively estimate the intensity of tropical cyclones based solely on visible and infrared satellite images. To apply the Dvorak technique, forecasters track the tropical storm over 24 hours to determine whether it has weakened, maintained its intensity, or strengthened. They then compare images of its central cloud and banding features with templates of typical storm patterns to see which of a number of possible pattern types it matches. Once a pattern is identified, the storm features (such as length and curvature of banding features) are further analyzed to arrive at a particular T-number. The T-number ranges between 1 (minimum intensity) and 8 (maximum intensity) in half point increments. The T-number can then be compared to a chart that gives an approximate surface wind speed and sea level pressure based on whether the storm is in the Atlantic or Pacific Basin. 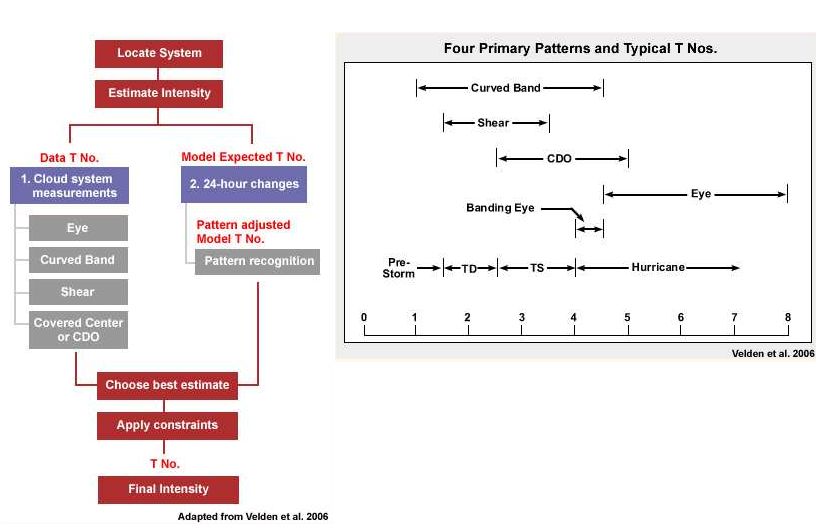 A more objective version of the technique can be applied if infrared satellite imagery is available for mature storms with definable Eye Patterns. Besides being more objective, the infrared technique can be used at night when visible imagery is not available. The T-number in this scheme is derived from the temperature difference between the temperature of the warm eye and the surrounding cold cloud tops, the greater the difference, the more intense the storm. While the Dvorak technique has its limitations, it has been the primary method used to determine a tropical cyclone's maximum sustained winds for some time, particularly in areas where direct measurements are not possible. Since its inception, remote sensing from satellites has improved to include the ability to actually measure surface winds from space (as discussed below), though such sensors are not flown on all weather satellites. The SeaWinds ScatterometerThe SeaWinds instrument package uses a scatterometer, a specialized microwave radar, to measure near-surface wind velocity (both speed and direction) under all weather and cloud conditions over Earth’s oceans. The SeaWinds scatterometer sweeps a circular pattern across broad regions on Earth’s surface using a rotating dish antenna with two spot beams. Scatterometers operate by sending radar pulses to the ocean surface and measuring the backscattered or echoed pulses bounced back to the satellite. The instrument thus senses small waves or ripples caused by winds near the ocean's surface, from which scientists can compute the winds' speed and direction. As winds increase, they further disturb the ocean surface, generating more small waves. These small waves reflect the radar energy toward the radar, resulting in a stronger reflection, similar to the way that wind blowing at the beach on a sunny day causes the ocean surface to sparkle. SeaWinds initially flew on the NSCAT satellite launched in August 1996 aboard the Advanced Earth Observing Satellite (ADEOS), a mission of the National Space Development Agency of Japan. When ADEOS lost power in 1997, the QuikSCAT (Quick Scatterometer) satellite was quickly assembled and launched in 1999. A SeaWinds instrument was part of the ADEOS II package launched in December 2002. When ADEOS II’s power failed in October 2003, QuikSCAT became the only US-owned instrument in orbit measuring ocean surface winds. (The European Space Agency has its own scatterometers in orbit, such as ERS-2.)
SeaWinds not only can determine the wind speeds within a tropical storm but can detect the early formation of tropical cyclones prior to their being classified as tropical storms. In the Eastern Pacific, where there are fewer weather stations and search aircraft, the use of the SeaWinds scatterometer can greatly improve tropical cyclone identification and prediction.
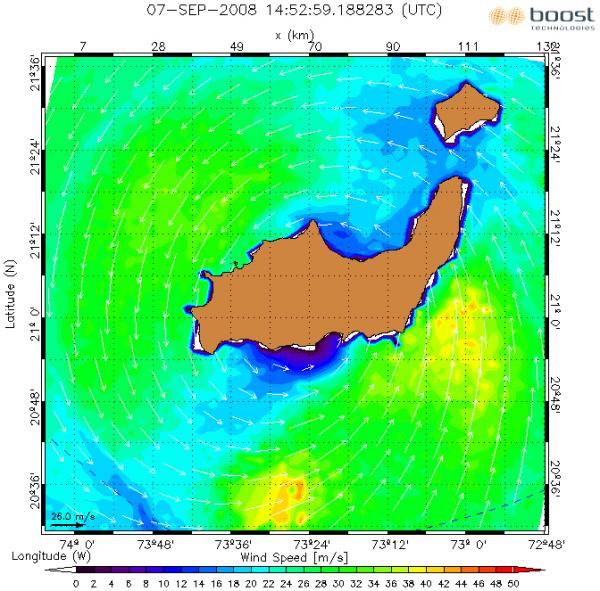
QuikSCAT data have revolutionized operational weather and storm forecasting. According to Paul Chang, ocean winds science team lead at NOAA’s National Environmental Satellite, Data, “QuikSCAT observations are now used around the world to support operational forecasting and warning of … tropical and extratropical cyclones…. The 10 years of observations from the QuikSCAT mission have provided critical information for the monitoring, modeling, forecasting and research of the atmosphere, oceans and climate.” Synthetic Aperture RadarAn alternate method of measuring tropical storm wind speeds from space uses Synthetic Aperture Radar (SAR). SAR is a type of radar in which multiple radar images are processed to yield higher resolution images than would be possible by conventional means. Thus, SAR has much higher spatial resolution than QuikSCAT, and thus, has a better ability to capture fine structure of wind distribution in storms. Spaceborne SAR, as found on Europe’s Envisat and ERS-2 and Canada’s Radarsat-1 and Radarsat-2, is not influenced by water vapor and rain much as the SeaWinds scatterometer, giving it more potential to accurately monitor hurricane wind speeds over the ocean. While optical satellite imagers show the swirling cloud-tops of a hurricane, SAR pierces through the clouds to show how the wind fields shape the sea surface, and estimate their likely destructive extent. As well, SAR had a much higher spatial resolution compared to QuikSCAT’s scatterometer.
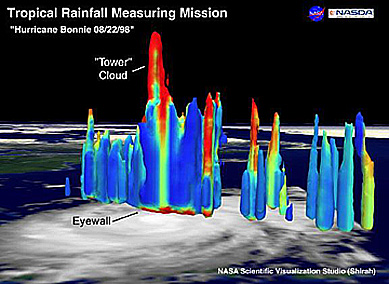
The Tropical Rainfall Measuring Mission (TRMM) satellite
In addition to providing realtime rainfall estimates, the rainfall analysis from the TRMM Microwave Imager and Precipitation Radar instruments can reveal a hurricane’s eye even when it is hidden from the satellites Visible and Infrared Scanner imagery. Another sensor aboard TRMM can obtain data of the vertical profile of weather elements within the hurricane structure.
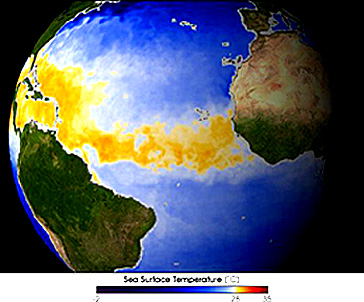
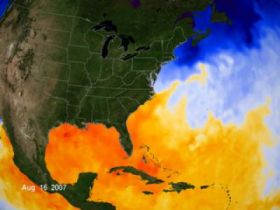
The image below is the result of automatic processes of East Pacific Tropical Storm Ignacio on 25 August 2009 observed by the TRMM satellite. TRMM VIRS, TMI and PR are processed for use in these displays. The "A" to "B" line on the static image on the left below is drawn where the highest value of radar reflectivity was found. Animations show multiple vertical cross sections (slices) of Precipitation Radar reflectivity. (NASA)  Sea Surface TemperatureKnowing sea-surface temperatures (SST) is critical in tropical storm forecasting. SSTs above 26.5 C (79.7 F) are generally favorable for the formation and sustaining of tropical storms: generally the higher the SST, the stronger the storm. Satellites measuring ocean water temperatures give information on thermal conditions in tropical waters that control and breed hurricanes and tropical storms. Since the 1980s, satellites measured the spatial and temporal variation in SSTs using certain wavelengths in the infrared and microwave portions of the electromagnetic spectrum. These observations provide storm forecasters with a synoptic view of the sea-surface temperature field that can then be related to changes in a storm’s intensity and path. NASA’s Moderate Resolution Imaging Spectroradiometer (MODIS) satellites have been providing global SST data since 2000. The TRMM satellite launched in 1997 was the first satellite microwave sensor capable of accurately measuring sea surface temperature through clouds using its Microwave Imager. Satellite microwave radiometry can measure SST in all weather conditions except rain.
The European Space Agency’s Envisat carries an Advanced Along Track Scanning Radiometer (AATSR) which senses the sea surface temperature down to a fraction of a degree across a wide swath of ocean. AATSR information can then be correlated with Medium Resolution Imaging Spectrometer (MERIS) cloud height and development data to gain a good estimate of the hurricane’s precipitation potential. Envisat also carries Advanced Synthetic Aperture Radar (ASAR) which can pierce right through the clouds to show the wind-wracked face of the sea beneath the storm. Other ObservationsCloudSat, launched in April 2006, uses an advanced radar to "slice" through clouds to see their vertical structure. This provides a completely new observational capability from space since previous weather satellites could only image the uppermost layers of clouds. CloudSat flies in formation with the Aqua satellite as part of NASA’s “A-Train” of Earth-observing satellites. 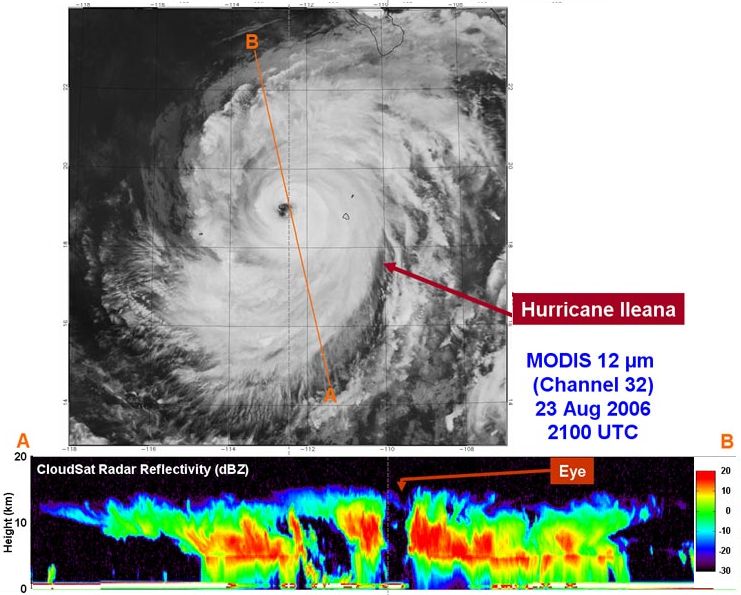 A new technique uses simultaneous, accurate measurements of cloud-top temperatures from the Moderate Resolution Imaging Spectroradiometer on NASA’s Aqua satellite, and cloud-top height and cloud profiling information from NASA’s CloudSat satellite for estimating the intensity of tropical cyclones from space. Developed by scientists from NASA’s Jet Propulsion Laboratory, Colorado State University, and the Massachusetts Institute of Technology, it could one day supplement existing techniques, assist in designing future tropical cyclone satellite observing systems, and improve disaster preparedness and recovery efforts. Currently, the primary technique in use is the Dvorak technique described above. Satellite information, of course, is of utmost importance during tropical storm events by providing forecasters with the information needed to make timely and accurate warnings to those in peril. After a storm, satellite images can assess the damage and impacts on the environment and human infrastructure by comparing images. The National Geospatial-Intelligence Agency, for example, has used spysat-snapped photos as well as commercial remote sensing spacecraft to piece together before-and-after data sets that capture a hurricane's impacts on a region struck by the storm. Learn More From These Relevant Books
|
|||||||||||||||||||||
 |
To Purchase Notecard, |
Order Today from Amazon! | |
 |
 |
To Order in Canada: |
To Order in Canada: |


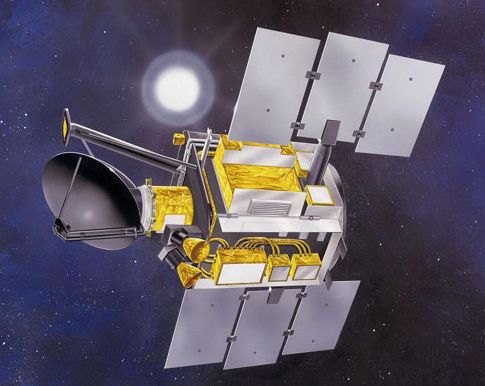
 Another aspect of tropical storm that merits watching is its rainfall. The Tropical Rainfall Measuring Mission (TRMM) satellite, a joint space mission between NASA and the Japan Aerospace Exploration Agency and launched in 1997 is the first mission dedicated to measuring tropical and subtropical rainfall. The TRMM satellite offers the best measurements of how and where rain falls around tropical cyclones. The TRMM sensors include: Microwave Imager (TMI), Precipitation Radar (PR) and Visible, Infrared Scanner (VIRS), Clouds and the Earths Radiant Energy System (CERES) and Lightning Imaging Sensor (LIS). TRMM is an oblique orbit satellite.