| < |
| < |
| Home | Welcome | What's New | Site Map | Glossary | Weather Doctor Amazon Store | Book Store | Accolades | Email Us |
 | |||||||||||||||||||
The 1993 Mississippi/Missouri Valley FloodIf the forecasts come to pass, 2011 could see the greatest flooding of the upper Mississippi/Missouri Valley since 1993. Flooding that year began in April and lasted in some areas as late as October. Along the floodplains of the Mississippi/Missouri River complex, floodwaters covered around 30,000 square miles (80,000 km˛) and cost the American economy around $15 billion ($22.3 billion in 2009 dollars) in damages across nine states. The story began the preceding Autumn when persistent rainfalls soaked the soils and filled reservoirs across the Mississippi/Missouri basin. The following Winter saw heavy snowfall across the region. Although not record breaking, the snow cover in the upper Mississippi River basin was above normal, particularly in southern areas. Across southern Minnesota and western and central Wisconsin, snow depths at the end of February 1993 were generally in the 9 to 18 inch (23-46 cm) range with a water equivalents of the 2 to 4 inches (5-10 cm). Spring storms then brought rainstorm after rainstorm across the upper Midwest. The pattern persisted into the Summer months. The period June through August 1993 saw rainfall totals exceed 12 inches (300 mm) across the eastern Dakotas, southern Minnesota, eastern Nebraska, Wisconsin, Kansas, Iowa, Missouri, Illinois, and Indiana. Over 24 inches (600 mm) of rain fell on central and northeastern Kansas, northern and central Missouri, most of Iowa, southern Minnesota, and southeastern Nebraska. And to top it off, 38.4 inches (975 mm) fell in east-central Iowa. (The usual precipitation across this region averages from 31 to 36 inches (790 to 915 mm) annually.) Some areas in the North Central American Plains measured rainfall totals that reached 400-750 percent of normal. North central Iowa saw as much as 48 inches (1200 mm) of rain between April 1 and August 31, 1993. And the rainfall was persistent with many locales observing measurable rain on 20 or more days in July. During one stretch, Fort Madison, Iowa saw rain on 54 of 58 days. In parts of the upper Mississippi basin, it rained every day from late June to late July. 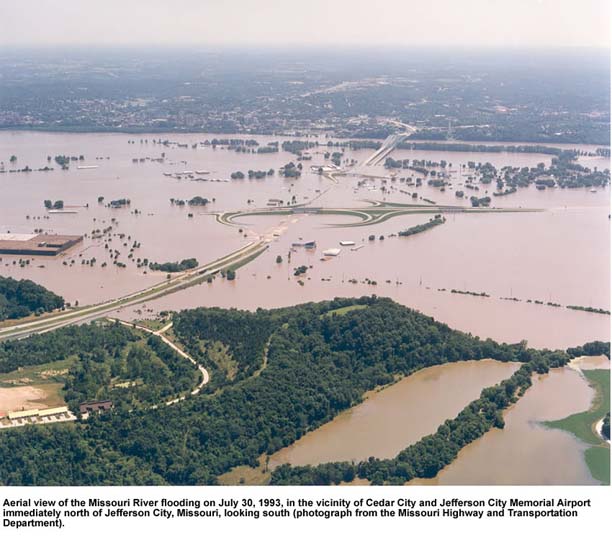 Both the Mississippi and Missouri Rivers reached flood stage almost simultaneously as their swollen tributaries sped water downstream. At one point, about 600 river forecast points in the Midwest were above flood stage as nearly 150 rivers and their tributaries were affected. When it finally seemed that the rivers had crested in early June, another wave of extremely moist air from the Gulf of Mexico flowed up the Mississippi Valley bringing more heavy rains to the upper Midwest (1 to 4 inches / 25 to 100 mm above normal). By month’s end, floodwaters were again rising. Precipitation across Missouri in July averaged 1 to 7 inches (25 to 175 mm) above normal. In the National Weather Service forecast area based in St. Louis, Missouri, which encompasses eastern Missouri and southwest Illinois, floodwaters rose above flood stage at 36 forecast points and broke twenty river-stage records. During much of June, the Mississippi River stood at 6–10 feet (1.8-3.0 m) above flood stage around St. Louis. The flooding hit the states of Minnesota, Iowa, Illinois, Wisconsin and Missouri hardest. Along their rivers, over a thousand levees built to hold back the floodwaters failed, but floodwalls in major cities like St Louis held back the waters. In April, the Mississippi River at St Louis had reached 6 to 10 feet (1.8-3.0 m) above flood stage, then receded, but once again reached near the same levels during the month of May. As early as 7 June, reports of overtopped levees and levee breaks became common along the Mississippi.  Flood monitoring gauge sites in Missouri. |
|||||||||||||||||||
 |
 |
Flooding at Alton Illinois |
Flooding at Grafton Illinois |
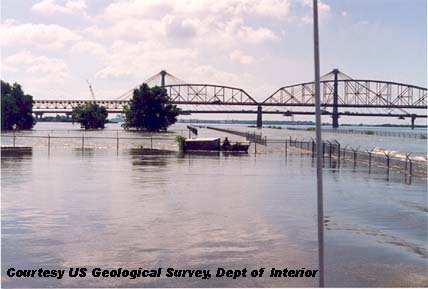
The flooding also affected transportation across the region. Critical barge traffic on both the Missouri and Mississippi Rivers was halted from late June until mid-August, as was much of the train traffic in the affected areas. The Missouri River was closed to navigation from July 2 to August20: 49 days. This required using road carriers to haul critical supplies and products. Many bridges across the rivers were unusable, including portions of some interstate highways. Ten commercial airports were flooded.
|
In early October, the Missouri River fell below flood stage at Jefferson City and St Charles, Missouri. On October 7, after 103 days, the Mississippi River at St. Louis finally dropped below flood stage. Farther downriver, the flood stage ended at Cape Girardeau, Missouri on October 12th. Millions of acres of farmland remained under water for weeks during the growing season. . In addition to the crop losses, many farms also lost livestock, vital structures, facilities, and equipment. The flooding also affected transportation across the region. Critical barge traffic on both the Missouri and Mississippi Rivers was halted from late June until mid-August, as was much of the train traffic in the affected areas. The Missouri River was closed to navigation from July 2 to August20: 49 days. This required using road carriers to haul critical supplies and products. Many bridges across the rivers were unusable, including portions of some interstate highways. Ten commercial airports were flooded. |
 |
|
In early October, the Missouri River fell below flood stage at Jefferson City and St Charles, Missouri. On October 7, after 103 days, the Mississippi River at St. Louis finally dropped below flood stage. Farther downriver, the flood stage ended at Cape Girardeau, Missouri on October 12th. |
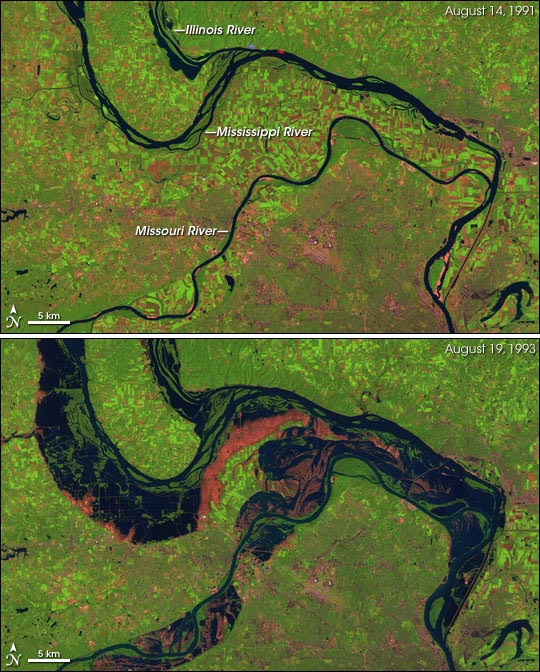
Great Flood of the Mississippi River, 1993This image pair shows the area around St. Louis, Missouri, in August 1991 and 1993. The 1993 image was captured slightly after the peak water levels in this part of the Mississippi River. Water appears dark blue, healthy vegetation is green, bare fields and freshly exposed soil are pink, and concrete is grey. The deep pink scars in the 1993 image show where flood waters have drawn back to reveal the scoured land. Landsat 5 - TM NASA images created by Jesse Allen, Earth Observatory, using data provided courtesy of the Landsat Project Science Office. |
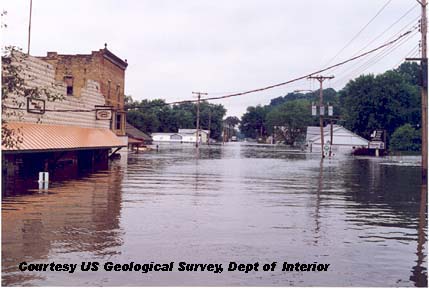
Millions of acres of farmland remained under water for weeks during the growing season. . In addition to the crop losses, many farms also lost livestock, vital structures, facilities, and equipment.
Forty-seven deaths were directly attributed to the flooding, and 74,000 residents were evacuated from their homes. An estimated 72,000 private homes either were washed away or suffered major damage. Between 35,000 and 45,000 commercial structures were damaged. The flooding resulted in the relocations of portions of towns such as Valmeyer, Illinois and Chelsea, Iowa.
 |
Now AvailableThe Field Guide to Natural Phenomena: |
 |
To Purchase Notecard, |
Order Today from Amazon! | |
 |
 |
To Order in Canada: |
To Order in Canada: |