It comes as no surprise that we humans love comparing, listing and ranking the world around us. The Guinness Book of World Records is but one example of this inclination. From Letterman's Top Ten list to the ranking of the nations by lifestyle, income, or crime rates, each serves a purpose, if only for humor's sake.
In the world of environmental hazards, we have a desire to know which were the ten most deadly, or damaging, or extensive events. And we usually want a quick assessment of a current hazard to compare it with the historic record. For years, scientists have devised ranking scales, often initially with the purpose of post-event comparison, but as we began detailed tracking of ongoing natural hazards, we need to place a storm, for example, in its place in current or historic memory.
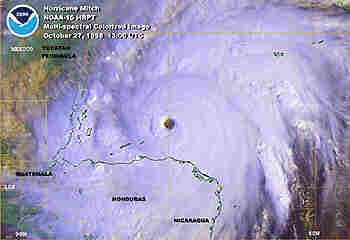
Category 5 Huricane Mitch Photo Courtesy of NOAA/US Dept of Commerce
In meteorology, we have the Fujita Scale for tornado damage and the Saffir-Simpson Scale for Hurricane (tropical storm) Damage, and also the various indices such as windchill and temperature-humidity indices that play a similar role in usually a less deadly weather event. In recent years, meteorologists have devised rating scales for winter storms and non-tropical storms. Though I have not done extensive research on this, I think the Beaufort Wind Force Scale was likely the forerunner of all of these, though Beaufort intended his scale as an observational tool for wind speed in the days before effective anemometers. (Beaufort's original highest force – 12 – was hurricane-force and referred to any conditions with winds above 64 knots.
It should be noted that the Saffir-Simpson Scale applies only to the Atlantic and Eastern Pacific Ocean regions. In the Western Pacific and Indian Oceans, slightly different scales are in use. For a comparison of these, see Tropical Cyclone Scales.
All these scales have inherent drawbacks, particularly those trying to categorize a phenomenon in one instant that is has a relatively long lifetime and covers a large spatial extent during that life. A tornado sets down in an agricultural field, then smashes a residential development, and finally moves over a wooded area before dissipating. Such a tornado might have times and places for which its Fujita scale rating goes from F0 to F5 to F1, and yet for most of that period, the actual storm strength may not have changed greatly. It is the nature of the beast that we can only assess its damage level and not get its true weight by standard meteorological observation.
A tornado such as the one that struck Moore, Oklahoma in 2013 could have followed my fictitious example with even more steps as it tore through different areas of the region. But we will always remember it for its most destructive state EF5 as we conjure up images seen on television of the destruction.
In the case of a longer lived tropical storm, it usually starts with a tropical storm rating and then as its life progresses may increase from a Category 1 to a Category 4 and back to a Category 2 storm before losing its tropical character. In the case of tropical storms, we are able to rate them by traditional meteorological measures such as wind speed and central barometric pressure. In the records, hurricanes are remembered by their highest rating. No matter that Katrina was not officially a Category 5 storm when it hit New Orleans.
In the past few years, we have seen upgrades to many of these scales. The original Fujita Scale (F) is now the Enhanced Fujita Scale (EF). Windchill determination was improved over the original concept to more fully realize the feel and dangers of cold and wind on humans. And now, we are seeing tweaks in the original Saffir-Simpson Hurricane Damage-Potential Scale.
The Saffir-Simpson Hurricane Wind Scale
When in 1971 Herbert Saffir and Dr Robert Simpson devised a scale for hurricane damage potential, it was based on the storm's peak wind speed. Their original scale was then modified to give an estimate of the potential property damage and flooding expected along the coast from a hurricane landfall, the Saffir-Simpson Hurricane Damage-Potential Scale, and thus the central barometric pressure and storm surge were added to the defining criteria. Later research indicated that this approach had drawbacks, and in 2009, the US National Hurricane Center (NHC) reverted back to the original idea and renamed it the Saffir-Simpson Hurricane Wind Scale (SSHWS) that only used wind speed as the determining factor. The Hurricane Wind Scale went into effect in 2010.
The scale was tweaked by the US National Hurricane Center in 2012 to “resolve awkwardness associated with conversions among the various units used for wind speed in advisory products.” The new modification clarifies categorization of wind speed measurements from the uncertainty that arises when reports are based on miles per hour (mph), kilometers per hour (km/h) or knots and then converted to one of the other units.
Because, due to uncertainty, storm wind speeds are usually reported to the nearest “5” value, eg, 12 becomes 10; 14 becomes 15, a problem can arise for the Category 4 classification. Category 4 had been defined as 131 to 155 mph (or 114 to 135 knots or 210 to 259 km/h). But units conversion here can cause a problem. If the wind reading is reported as 115 knots, it denotes a Category 4 hurricane level. However, when 115 knots is converted to mph (132.3 mph), and it is rounded to the nearest 5-increment (130 mph), the hurricane then comes into the wind speed slot defining it as a Category 3 hurricane.
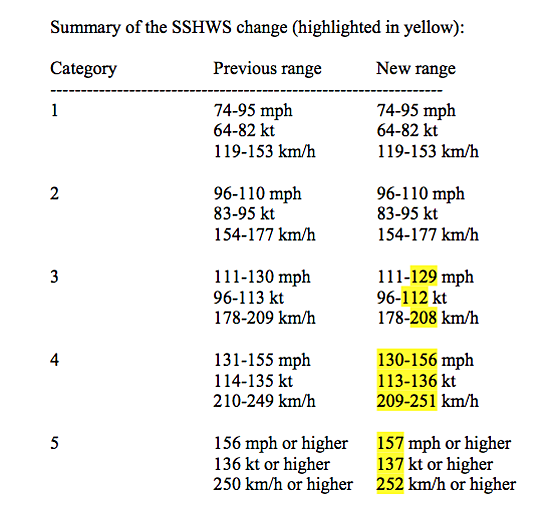
The new scale removes this issue. Categories 1 and 2 remain the same, but Category 3 (formerly 96 to 113 knots) will now be measured as 96 to 112 knots or 111 to 129 mph or 178 to 208 km/h. Category 4 limits become 113 to 136 knots or 130 to 156 mph or 209 to 251 km/h, and Category 5 defined as 137 knots or higher, or 157 mph or higher. or 252 km/h or higher.
The classification system changes can be seen in this chart provided by NHC:
The change in no way affects previous storm classifications.
Other Tropical Storm Classification Systems
The new Saffir-Simpson wind tropical storm categorization scheme does not address fundamental issues of how to rate damage from tropical storms but makes the Saffir-Simpson categories easier to determine. We know that, although the wind is the telling characteristic of a storm through its lifetime, it is not always the deadliest factor when a storm hits land. Flooding due to storm surge or torrential rains with subsequent flooding often kill more people and damage more property than the winds. And from a bigger picture, the areal extent and length of a storm's lifetime or passage over an area may also outweigh the peak winds as a factor in determining a storm's damage potential.
While I will not go deeply into other schemes that have been proposed, I will mention a few of those that might be mentioned in the media and technical reports.
Accumulated Cyclone Energy or ACE
The first is the accumulated cyclone energy or ACE. ACE has an interesting basis in that it can be calculated for an individual storm as well as for a cumulative storm season. Basically, ACE is calculated by summing the square of the wind speed (in knots) measured every six hours over the storm's lifetime as a tropical storm. The final sum is divided by 10,000 to make the number manageable. A similar index called the hurricane destruction potential (HDP) and is calculated for the time the storm is of hurricane strength.
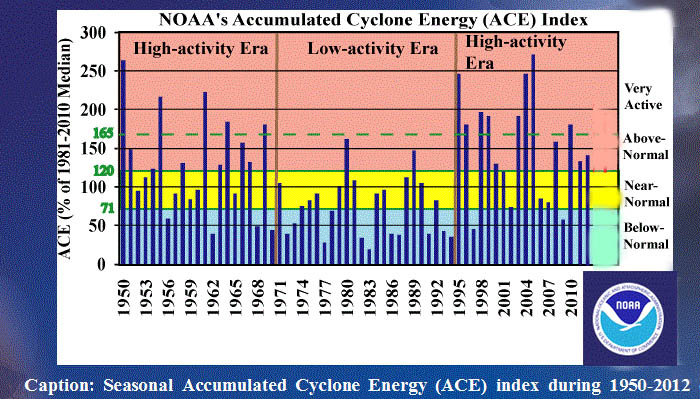
Its use as a seasonal indicator can be seen as an indication of a year's tropical activity and has been its prime application by NOAA. In the application of ACE, a few very strong and long-lasting storms can have a greater impact on a season's energy level than a season with many weaker storms. NOAA uses the ACE index, combined with the seasonal total number of named storms, hurricanes, and major hurricanes, to categorize North Atlantic hurricane seasons as being above normal, near normal, or below normal. The criteria NOAA uses for defining seasonal character are:
Above-normal season: An ACE index above 111 x 104 knot2 (corresponding to 120% of the 1981-2010 median), with at least two of the following three conditions: 13 or more named storms, 7 or more hurricanes, and 3 or more major hurricanes.
Below-normal season: a) An ACE index below 66 x 104 knot2 (corresponding to less than 71.4% of the 1981-2010 median), or b) An ACE index above 71.4% of the median with the following three conditions: 9 or fewer named storms, 4 or fewer hurricanes, 1 or fewer major hurricanes.
Near-normal season: Neither the above- nor below-normal season criterion are met. A near-normal season will typically have an ACE range of 66-111 x 104 knot2 (corresponding to 71.4%-120% of the 1981-2010 median).
An historical graph of the annual ACE values from 1950 to 2012 is given below.
Integrated Kinetic Energy or IKE
An index that puts the storm surge aspect back into the picture is the Integrated Kinetic Energy, or IKE, index. Created by Mark Powell of NOAA and Tim Reinhold (a former slo-pitch teammate of mine) of the Insurance Institute for Business and Home Safety under a government contract, IKE accounts for the stress the storm winds exert on the ocean surface that creates the storm surge. It is measured along a continuous scale from 0 to 5.99, instead of discrete jumps from 1 to 5 as with the Saffir-Simpson categories.
Track Integrated Kinetic Energy or TIKE
A newer index that has emerged recently is the Track Integrated Kinetic Energy, or TIKE, which builds from the measure of storm integrated kinetic energy (IKE). Developed by scientists at Florida State University lead by Vasu Misra, TIKE “expands the IKE concept by adding IKE measurements over the lifespan of a tropical cyclone, as well as over all named tropical cyclones in the hurricane season.” The team feels that TIKE would help augment the Accumulated Cyclone Energy (ACE) index currently in use by NOAA.
Hurricane Severity Index or HSI
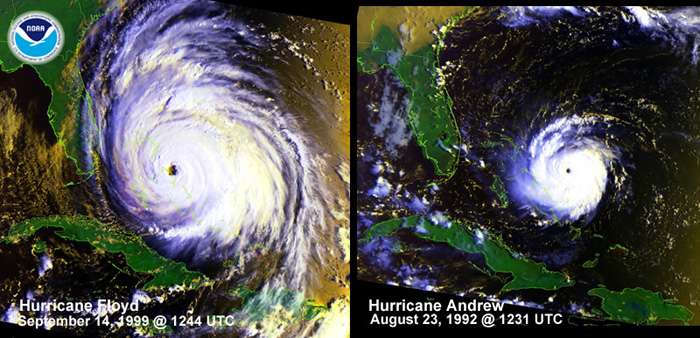
Finally, two ImpactWeather meteorologists Chris Hebert and Bob Weinzapfel devised the Hurricane Severity Index (HSI) to define the strength and destructive capability of a tropical storm. HSI adds an areal component to the concerns over wind speed by using equations which incorporate the intensity of the winds and the size of the area covered by various levels of wind speed. The index uses a 50-point scale, half which is based on wind intensity, and half based on the wind field size. The wind field factor is based on the wind radii ranges of four wind field levels (39, 58, 74, and 100 mph).
Size comparison of the major hurricanes Floyd and Andrew Photo courtesy NOAA
Still Limitations
Note that none of the indices above consider rainfall which is often the deadliest consequence of a tropical storm. This is not as much a criticism on my part but a recognition that more work needs to be done in defining the impact of a tropical storm. The major desire for a quick and simple to understand index is that it can raise awareness in the public within the path of a storm. The SSHWS is still the best tool that can be augmented with other indices to warn of the dangers of storm surge and flooding.
Learn More From These Relevant Books Chosen by The Weather Doctor