Weather Almanac for May 2013
NORMALS, FREAKS AND
RARE WEATHER EVENTS

Like most folks in North America, I am wondering if real Spring weather will ever come this year. Perhaps we will just jump into Summer with the start of solar summer on May First. I perhaps shouldn't complain, for us here in Valemount, the spring has been rather benign, and perhaps boring, and definitely not as bad as on the eastern side of the Rockies where our Alberta neighbors have had cold and snow in excess for a couple months now. And in Eastern Canada and much of the United States to the south, winter weather decided to make a very late appearance after spring-like conditions in January and much of February. Besides, here in the northern Rockies, spring doesn't really begin until May.
The folks in the East have been cursing the Groundhog, and even threatening legal action, when March roared in and growled with wintry weather that is still prevailing in many areas past mid April 2013. He was actually correct for February, when spring came early, but Spring must have been bored and returned from whence it came and gave the continent back to Old Man Winter. We more rightly should be blaming the Arctic Oscillation for the return. In any case, many are grumpy, and so, am I.
 Not sure why I should be, I got out for a last (albeit also the first) ski on the Marsh in late March but had my bicycle out and about on Easter Sunday. And now, getting around town is much faster. So Spring is arriving here about on schedule, and our temperatures have been warmer than what Environment Canada posts as our normal conditions on its forecast page for Valemount. Not sure why I should be, I got out for a last (albeit also the first) ski on the Marsh in late March but had my bicycle out and about on Easter Sunday. And now, getting around town is much faster. So Spring is arriving here about on schedule, and our temperatures have been warmer than what Environment Canada posts as our normal conditions on its forecast page for Valemount.
I have gotten over my annual grumpiness over the continual references to “official” Spring having begun at the equinox and am likely a few weeks away from that reference with respect to “official” summer.
What has me grumpy at present is the characterization by the media over what constitutes a “rare” or “freak” weather event. I can understand that they tend to use such terms to get our attention, and not in the pseudo profanity sense of “how about that freaking weather.” But from a strictly factual basis, they are often wrong. Thus, this month, I am writing more as a climatologist than a meteorologist since the basis for this stems from what we believe about “normal” weather and climate.
What is Normal?
The first concept to ponder is the use of the term normal when referring to weather events. It perhaps all begins with the Climate Normals published by climatologists at the end of every decade.
The problem is that the term “Normals” is not truly correct. It is my understanding that climatologists once believed that climate did not change over moderately long-time periods and it was possible to calculated what the weather conditions should be like given a sufficient record length. Statistical analysis suggested that 30 years would be long enough to define stable periods of climate with regard to temperature and precipitation, as well as other meteorological properties. To such a statistical record, the term Climate Normals was given.
In everyday English, the word normal denotes the way we believe things should be. What we have unless something abnormal is occurring. “Regular or typical in the sense of lying within the limits of common occurrence” is one dictionary definition. But this standard meaning differs from what is meant in the climatological sense.
The definition for normal in relation to climate normals from the World Meteorological Organization (WMO) is
“Climate 'normals' are reference points used by climatologists to compare current climatological trends to that of the past or what is considered 'normal'. A Normal is defined as the arithmetic average of a climate element (e.g. temperature) over a 30-year period. A 30 year period is used, as it is long enough to filter out any interannual variation or anomalies, but also short enough to be able to show longer climatic trends. The current climate normal period is calculated from 1 January 1981 to 31 December 2010.”
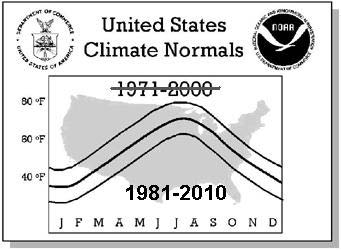
The recommended international usage is to recalculate the normals at the end of every decade using the preceding 30 years.
The Glossary of Meteorology published by the American Meteorological Society has this to say about the current meaning of normal with regard to climate statistics:
"As usually used in meteorology, the average value of a meteorological element over any fixed period of years that is recognized as a standard for the country and element concerned. Often erroneously interpreted by the general public as meaning the weather patterns that one should expect. In the broadest sense, 'normals' should consist of a suite of descriptive statistics, including measures of central tendency ... and frequency of occurrence. At the International Meteorological Conference at Warsaw in 1935, the years 1901–30 were selected as the international standard period for normals. Recommended international usage is to recalculate the normals at the end of every decade using the preceding 30 years. This practice is used to take account of the slow changes in climate and to add more recently established stations to the network with observed normals. ... The years covered by a normal should always be clearly stated, since averages for different periods of the same length are rarely the same.”
Of note is the sentence “Often erroneously interpreted by the general public as meaning the weather patterns that one should expect.” Even more telling, is the fact that if the weather at a non-tropical location (the low variability of weather conditions in tropical areas makes the likelihood of “normal” more probable) actually had all the elements of those given in the Climate Normals for a particular day and place, many would consider that as truly abnormal.
When your media source reports what the “normal” conditions are for a particular day, they are really saying this was the average condition over a particular 30-year period recently ended. In a world where climate is changing, and it always is, to expect these “normals” is misguided. In a rapidly changing climate, they may have no real meaning the further one gets from the defining period.
It has been a simple rule of thumb that if one forecasts tomorrow's weather with today's conditions, you have about a 60 percent chance of being correct within a small margin of variability. Weather generally follows a pattern and the odds are good, in general, that tomorrow will be like today within a small window of variability. Under some conditions, you could have a much higher chance of this coming true and for some others, a very low chance such as when a low pressure system is going through. A further part of that rule of thumb is that a forecast for tomorrow to be the climatological normal has only about a 40 percent chance of being correct.
Intuitively I should think the normal should have a higher degree of possibility if it were truly normal. To be below a 50-50 chance, is perhaps disheartening. Flip a coin and you might do better.
Another point is that the normal denotes weather we should expect and from my experience, weather memory is often dead wrong. I can't tell you how many times I have been asked over the years to collaborate someone's recall of weather on a long past day, or the story given to them by others. (This often is asked for a birthdate or other significant personal event.)
We frequently will find in a news article, particularly in the pre-weather records days when the newspaper would often ask the older folks in town to comment. The terms “worst in living memory” is often used in such stories on weather conditions far from the expected norm. (I still have a pretty good memory for events, but as I commented last month, I can't recall the date or even year for a major spring snowstorm in southern Ontario.)
Non-Normal Conditions
Carrying the thought from that last paragraph, opens the other side of this coin. If we have so much trouble defining what our expectations should be for the weather with regard to “normal”, what do we make of conditions well out of the expected. What should we consider abnormal, rare or perhaps a “freak” event? How “well out” is well out. Or in the vernacular of the 1960s, how far out is “far out”?
The answer to that question is further compounded by the nature of the weather elements. Precipitation and temperature have vary different characteristics when we look at “normals” and extremes. And what about those elements like tornadoes or hurricanes, that may only happen at a location a few times in a decade or more.
In the course of a year, we always have temperature, the true value is never non-existent, though we do have zero temperatures on both the Celsius and Fahrenheit scales, but they do not mean an absence but an arbitrary reference point. We can have negative (below zero) temperatures on both scales. If we were to plot the number of occurrences of daily maximum temperature against the temperature value, we would approximate the statistician's normal distribution curve (the so-called “bell curve” we may remember from school days). One temperature, or a small band of temperatures would be the most frequent with the extremes on both sides having rather small number of occurrences. In an ideal situation, the mean (the average), the median (the point with the same number of values either above or below it) and the mode (the most frequent observation) are the same point. In real world data, the three may not coincide. (It might be better if weather data reports gave the mode rather than the mean as the value we should expect to happen. True they are often close, but not always.)
 The Normal or Bell Curve Distribution In a normal distribution, it is standard to consider the “tails”, those points at the high and low value extremes of the distribution, to be the extreme of abnormal readings in the period of record. The distance from the central values that we take as being the extreme limits is somewhat arbitrary and I will talk of that later.
Daily precipitation (rain, snow and other frozen types) is an interesting statistic for this discussion. Unlike temperature, there are many zero values, meaning no precipitation, during the course of the records, and we cannot have a negative value. Thus, precipitation does not fall into a normal distribution curve.
As an example, let's look at the climate statistics of daily precipitation for Madison, Wisconsin, a site rather typical of the continental climate of North America. Over the course of the year (based on the 1971-2000 climate normals), Madison receives a measurable amount (0.01 inch) of liquid-equivalent precipitation on about 125 days each year with an annual total of around 33 inches. Just over half of those wet days receives an accumulation of more than 0.10 inches.
What then would we consider a “normal” amount of precipitation for a given? Should it be none since dry days are more common than wet? Should we divide the total precipitation by the number of days and consider 0.09 inches? Neither makes much sense even if we partitioned the data into single day records.
Now the answer cannot be a simple amount, but a probability of a certain amount. falling About 2/3rds of the days are dry and if precipitation falls, only about 34 percent or so would have totals above 0.01 inches (some would report a trace); about 17 percent see 0.1 inches or more and only about 5 percent measure more than 0.5 inch.
 Distribution Probability of Precipitation Amount for Madison, Wisconsin
Courtesy Wisconsin State ClimatologistThe graph to the right is the Frequency Distribution of Daily Precipitation for Madison prepared by the Wisconsin State Climatology Office that shows to probability of having a given amount of precipitation.
If we cannot define a true expected daily value in the same absolute terms, as we can for temperature, can we find what could be considered as an abnormal amount. The answer is yes: all we need do is define the amount or probability that we consider to constitute an abnormal event.
Rare Weather Events
In order to call an event rare, we must have some idea of how infrequent it is, or to say that another way, how infrequent should an event be to be considered as rare?
The dictionary definitions of rare relevant to our discussion (neglecting meanings such as in reference to a cooked piece of meat) give:
1. Infrequently occurring; uncommon: a rare event; a plant that is rare in this region.
2. Excellent; extraordinary: a rare sense of honor.
3. Thin in density: rarefied: rare air.
The first definition is most pertinent to this discussion and can be further defined to indicate if the event is uncommon, infrequent, or scarce:
1. not common or ordinarily encountered; unusually great in amount or remarkable in kind;
2. recurring only at long intervals; a rare appearance;
3. not widely distributed, a rare patch of vegetation in a desert.
Thus rare can refer to an event with respect to time or place. Snow in Madison is not rare in January but is in July. If an event is very common, like a day with clouds, its likelihood in terms of probability is nearer to 100 percent than not. If very uncommon, the likelihood is closer to zero probability. How close is best based on the application.
I once appeared as an expert witness in a court case where the defendant argued that the damage was done by extraordinary wind speeds, and thus the event was rare and an act of god that he could not have foreseen. The statistics showed otherwise, and the wind speed in question happened at least annually over the climatological record. The prosecution argued that for an “act of god” defense, the event should be much more infrequent. I believe that a probability of once every 50 years or more was the threshold probability used as the benchmark.
Going back to Madison, snow happens annually but I have no indication it has ever happened in July. The former event would not be rare but the latter would: a function of time at that place. Snow in Honolulu, Hawaii regardless of season would be a rare event: a function solely of place.
The frequently used standard for what describes a rare weather event is a probability of 0.05, one in 20, which we can say is once in 20 years. This would encompass events falling within the 5th or 95th percentiles in a normal distribution.
The reporting of events can be complicated by the fact that an event may not be rare over a particular geographic region, but be rare at a specific location. It is almost a completely true statement to say that a tornado hitting a particular community is a rare event (defining it as less than once every 20 years) anywhere in the US. But to say that a tornado in the southeastern US states is rare, isn't true as they happen annually in this section of the nation and often with multiple events.
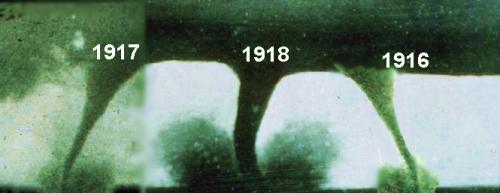
On the 20th day of May in 1916, 1917, and 1918,
Codell, Kansas was hit by a tornado.
A truly rare event.
In researching this piece, I came across an interesting article “Defining a Rare Coin” by Richard Giedroyc who stated: “The words rare, scarce, and desirable are probably the most abused terms not only in coin collecting, but within antiques and collectibles in general. How can you truly define these rather intangible terms? Each of these terms is relative. Each is a perception.”
The President's Water Commission in 1950 remarked: “However big floods get, there will always be a bigger one coming; so says one theory of extremes, and experience suggests it is true.”
I'll finish up this piece with a look at using return periods to assess extreme events, but first I will remark on the last of my title topics: freak events.
Freak Events
For some reason, I shudder at the sound of a newscaster describing a significant weather event as a “freak storm” or “freak weather”. It affects me the same way that the term “weather weenie” has been used to describe someone who is a big fan of weather or the description of significant weather by my esteemed colleague Dave Phillips of Environment Canada as “wacky weather.” For him it has become a trademark phrase, but to me it is the equivalent of fingernails on the chalkboard. Indeed, I almost “freak out!”
Any way. I can understand that “freak” is a good attention grabber similar to the use of “rare” but like that term it seems inappropriately used in many circumstances.
The dictionary definitions of freak describe the meaning as:
1. a person or animal or even a plant that is born or grows with abnormal physical features;
2. an unusual, unexpected natural phenomenon;
3. an event that is extremely unusual or unlikely.
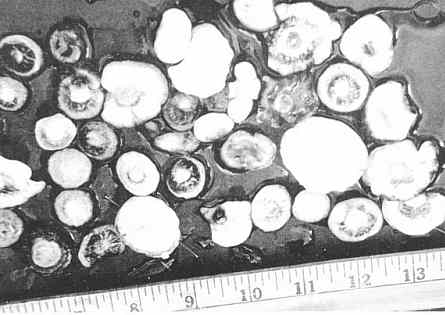
Assorted Hailstones: A Freak Storm?
(Credit: NOAA Photo Library)
There are other meanings such as those that would equate a weather weenie with a weather freak, or as someone whose behavior is outside the realm of “the norm”, like a control freak.
In my mind, I don't think of a weather event considered as a freak event in the same way I think of a two-headed calf or a fifth leg on a pig. I take the meaning intended by definition 3 above and judge it similar to the overuse of rare.
Okay, I had my rant on this, now back to some serious discussion.
Return Period for Extreme Events
To finish up this discussion, I feel I should mention a topic that fits well with the concepts of normal and rare. That is the concept of the return period for events, particularly those with a meteorological application. The definition of return period or recurrence interval:
an estimate of the likelihood of an event, such as a flood or a high wind event to occur. It is a statistical entity typically based on historic data denoting the average recurrence interval over an extended period of time, and is usually used for risk analysis or to design structures to withstand an event with a certain return period.
The return period is a statistical result of an analysis of a series of data points, usually over a long period of record of infrequent events. The analysis assumes the probability of the event in question does not change over time and that the events are independent of each other. The former assumption can be shaky, and the latter assumes there is no link between any events which may not be strictly true.
 Return Period Graph for Extreme Daily Precipitation
(for Ficticious Centretown)As an example, I will look at flooding risk as it is often the application most used in climatology. Let us assume I want to build my home in a river valley and am concerned about the chances of flooding. The observations used here are river height above a reference point, which I can translate to elevation above mean water level in the valley, and I have an observation record of 50 years. I must assume that the same factors affecting the river depth have not changed in those 50 years, which often is not true as the watershed has likely changed in character, perhaps due to forest clearing or urbanization. Unless a period of high water occurred over the transition from one year to the next (here I will use the calendar year), the assumption of independence is acceptable.
Now I pick the highest measured water level for each of the 50 calendar years and perform the statistical analysis for extreme events on the data. This will give me a return period graph or table, or an equation where I can choose my extreme of concern and calculate its return period. By using this analysis, I can extend the assessment of an extreme event beyond the limits of the data set, e.g., to 100. 200 and 500 year events.
The return period is in essence the inverse of the probability (expressed as a percent) that the event will occur times 100. For example, an event with a 1 percent probability (0.01) of the river reaching a specified level has a 100-year return period. It can be expected there will be one such occurrence in a 100 year period. That does not mean it or a greater level won't happen for 100 years, or that it won't happen in the coming year. And there is approximately a 63.4% chance of one or more 100-year levels occurring in any 100-year period.
Using my example, if I decide to build my house at the highest mark measured in the 50-year record, the return period would be 2 percent or thereabouts (depending on the data set, the analysis may not precisely fit every data point), or once every 50 years. But that does not mean that it may not happen, or even be exceeded in the near future, say the next five years. I could also use the analysis to determine how high I should build to avoid the consequences of a 100-year level, for which the model will make an estimate based on the 50 year record. I could also choose a level above mean river level and determine what its return period would be. If I choose too low, such as the height that relates to the 10 year return period, it may not be worth the risk to build there.
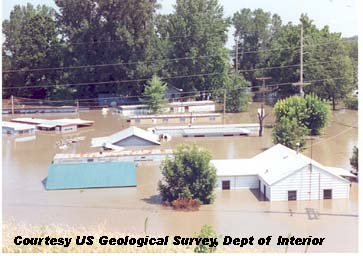 Spring FloodingThe same type of analysis is often used in determining risk and design criteria. In this case, as with my home location, there is often a gain or loss consideration. It may be cheaper to build at a lower level --- and perhaps incorporate some safety factors in the design --- and run the greater risk than to take the higher site.
Engineers designing a dam, for example, must consider the risk of failure versus the cost of a stronger structure for which the return period analysis provides a tool to aid in that determination.
This discussion is slightly off topic, but it points to another means of determining ”rare” events. It might be a more accurate statistic to report; however, being a more complex determination, it would take time to educate the public and not fall into the same trap as the use of rare.
A Final Thought
As an avid listener to the podcast A Way With Words, I am familiar with the continuing evolution of the English language. In fact I frequently bend the “rules” in my writings. I perhaps should not be as linguistically conservative, to use a phrase in a recent blog from the University of Michigan: Talking About Words.
Such discussions remind me that we have a living language that can even morph a word to mean its opposite with time, rendering the old definition obsolete.
Maybe it is a sign of my getting old and less tolerant of change. Or perhaps it is a sign of the need for the media to grab our attention in a world so overflowing with data that we just tune out most of the time.
Thanks for reading, I hope I made some sense of the topic.
Learn More From These Relevant Books
Chosen by The Weather Doctor
- Heidorn, Keith C. and Ian Whitelaw: The Field Guide to Natural Phenomena:
The Secret World of Optical, Atmospheric and Celestial Wonders, 2010, ISBN 1554077079
- Williams, Jack: The AMS Weather Book: The Ultimate Guide to America's Weather , 2009, University Of Chicago Press, ISBN: 0226898989.
- Burt, Christopher C.: Extreme Weather: A Guide and Record Book, 2007, W. W. Norton & Company, ISBN 039333015X, paperback.
Written by
Keith C. Heidorn, PhD, THE WEATHER DOCTOR,
May 1, 2013
The Weather Doctor's Weather Almanac: Normals, Freaks and Rare Weather Events
©2013, Keith C. Heidorn, PhD. All Rights Reserved.
Correspondence may be sent via email to: see@islandnet.com.
For More Weather Doctor articles, go to our Site Map.
 |
Now Available The Field Guide to Natural Phenomena:
The Secret World of Optical, Atmospheric and Celestial Wonders
by Keith C Heidorn, PhD and Ian Whitelaw |
Now Available! Order Today! |
 |
 |
|
|
Home |
Welcome |
What's New |
Site Map |
Glossary |
Weather Doctor Amazon Store |
Book Store |
Accolades |
Email Us
|