This month, I want to look at tornadoes from a climatologist's point of view, and in some respects, continue on with last month's discussion on normals and rare events. As of this writing, the United States was finishing a stretch with one of the lowest number of tornado occurrences in modern records.
The link to last month's Almanac came when I read Henry Margusity's Accuweather blog Meteorological Madness. In it, he makes the interesting statement concerning the 2013 dearth of tornadoes:
“Keep in mind, while the lack of tornadoes has been a good thing, it does show us how this pattern rates extreme in a different manner then one would think. We tend to think of extremes being weather that causes death and destruction, but in this case, the lack of a specific weather event over a long period is just as extreme.”
If a Tornado Strikes in the Open Plains, Is It Severe?
The heading title here paraphrases the old quandary of a tree falling in the wilderness, but it also makes a technical point. Since the two Fujita scales base the strength of the tornado on the damage it caused, a twister churning up dirt and grass would rate low on a damage scale almost without regard to its true strength. The same storm striking a residential area would likely do considerable damage and rate much higher. This is not a condemnation of the methodology, but our current inability to accurately measure the force/energy of all tornadoes in real time. (If you have followed shows such as Storm Chasers, you know the difficulty of getting real-time measurements of winds generated in tornadic vortices, unless the portable doppler radars get close. I emphasized all because there are some caught by the dopplers that can be measured.)
The ability to catch the fleeting nature of tornadoes has changed dramatically since I was a kid growing up in Northeastern Illinois. For the most part, tornadoes were then reported based on the damage they left behind, and many only tore down vegetation or tore up crop land and were largely uncounted. I recall one in 1959, I believe, that rumbled through the newly planted cornfields that less than a decade after would have rumbled through a community of more than 10,000. It tore up some corn and did no other damage, and so is unlisted in Grazulis' book Significant Tornadoes.
But today, with advanced radar, mesoscale observational networks, a cadre of well-trained local storm spotters, citizens with a variety of photographic and video devices, and an army of storm chasers following nearly every cumulonimbus in sight, it is hard for a tornado to miss detection. Add to the mix an increase in population in areas that may fall under a tornado event, and thus more eyes to see them.
Given that a good number of tornadoes are viewed by dozens, and perhaps hundreds of eyes, how do we count the actual number of storms given that observers may be seeing the same storm from a different angle, different storms in a cluster, or perhaps misinterpreting an oddly shaped cloud, downburst, or rainshaft as a tornado?
The US National Oceanic and Atmospheric Administration (NOAA) recognizes this difficulty. In their discussion on counting tornadoes, they state:
“One of the main difficulties with tornado records is that a tornado, or evidence of a tornado must have been observed. Unlike rainfall or temperature, which may be measured by a fixed instrument, tornadoes are ephemeral and very unpredictable. If a tornado occurs in a place with few or no people, it is not likely to be documented. Unfortunately, much of what we know as tornado alley was very sparsely populated until the 20th century, and so it is possible that many significant tornadoes may never have made it into the historical record.”
“Today, nearly all of the United States is reasonably well populated, or at least covered by NOAA's Doppler weather radars. Even if a tornado is not actually observed, modern damage assessments by NWS personnel can discern if a tornado caused the damage, and if so, how strong the tornado may have been. This disparity between tornado records of the past and current records contributes a great deal of uncertainty regarding questions about the long-term behavior or patterns of tornado occurrence. Improved tornado observation practices have led to an increase in the number of reported weaker tornadoes, and in recent years the number of EF-0 and EF-1 tornadoes have become more prevelant in the total number of reported tornadoes. In addition, even today many smaller tornadoes still may go undocumented in places with low populations or inconsistent communication facilities.”
“With increased national Doppler radar coverage, increasing population, and greater attention to tornado reporting, there has been an increase in the number of tornado reports over the past several decades. This can create a misleading appearance of an increasing trend in tornado frequency. To better understand the true variability and trend in tornado frequency in the U.S., the total number of strong to violent tornadoes (EF3 to EF5 category on the Enhanced Fujita scale) can be analyzed. These are the tornadoes that would have likely been reported even during the decades before Doppler radar use became widespread and practices resulted in increasing tornado reports.”
As a result, the number of storm reports generated during bouts of severe weather often greatly overstate the actual number of tornadoes. Assessment teams comb the reports and seek out the areas of storm damage to determine if indeed it was a tornado. Once the damage is established as from a tornadic storm, its EF rating must be determined along with any information that may shed light on its path, width, or duration.
The National Weather Service (NWS) has a rule of thumb that for every 100 preliminary tornado reports, at least 65 tornadoes are typically confirmed by the assessment teams. Thus, the initial number of storms reported by the Storm Prediction Center (SPC) takes some time to investigate, and the final count published by the SPC may not be determined for several months when all reports have been investigated. Thus, final monthly numbers are typically less than the preliminary counts reported at the end of a calendar month.
Are the Number of Tornadoes Increasing?
This statement can be interpreted in two ways.
First, it is obvious from the above discussion that the number of tornadoes reported has increased dramatically over the past half century in the United States (and elsewhere around the world for many of the same reasons). And as NOAA said above, that increase in seen most in the weaker storms: “the number of EF-0 and EF-1 tornadoes have become more prevelant in the total number of reported tornadoes.”
The second interpretation to the question is concerned with the true trend in tornado events. This is an important question in the climate change debate as well as concerns over public safety.
To look toward an answer, NWS scientists have looked at the observation numbers for a preliminary answer. To do so, they first must find a way to account for obvious trends in the numbers for reasons cited above. Again, as stated above, they look to “better understand the true variability and trend in tornado frequency in the U.S., [using] the total number of strong to violent tornadoes (EF3 to EF5 category on the Enhanced Fujita scale).”
Annual Total of Tornadoes rated F3 or Higher: 1954-2012 Courtesy US NOAA National Storm Prediction Center
Harold Brooks, of the National Severe Storms Laboratory and Greg Carbin, of the Storm Prediction Centre, published an analysis of tornado numbers from 1954 to the present.
Annual Total of Observed Tornadoes (red line) : 1954-2000 From Brooks and Carbin, Courtesy US NOAA National Storm Prediction Center
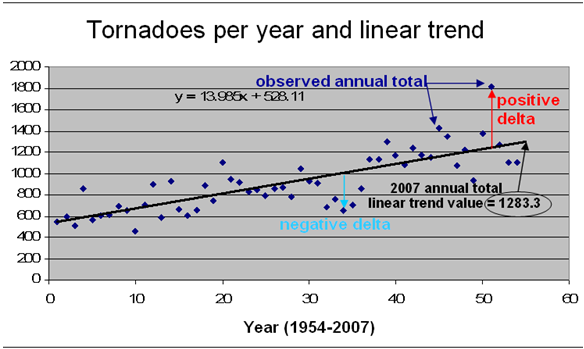
To correct for changes in observational influences, they used a simple linear regression equation fit to the 1954-2007 annual tornado totals. From this equation, they computed the difference between the original/observed annual tornado total and the smoothed, or "adjusted" annual total represented by the point on the linear trend line for that year.
Trend Line for Tornado Numbers: 1954-2000 From Brooks and Carbin, Courtesy US NOAA National Storm Prediction Center
This leaves us with an “adjusted average across the 54-year period, or 1283.3 tornadoes per year. This value is also the max trend line value at 2007 that was combined with the individual delta value for each year to adjust all annual totals in the data set. The daily tornado running totals for each year are then adjusted by multiplying the original observed daily running total by the annual adjustment factor:”
The result is the following chart that shows the effect of the judgment. Of course, the method cannot give any insight to earlier years, and assumes that the observational improvement is linear over the period, which may not strictly be the case. For example, aids such as the camera in a cell phone did not gradually improve over the period but suddenly began when the technology improved. While not perfect, it is at least a step to adjust tornado numbers.
Adjusted Tornado Numbers (blue line): 1954-2000 From Brooks and Carbin, Courtesy US NOAA National Storm Prediction Center
If we compare the total adjusted number of all tornadoes curve with the time series of tornadoes rated as F3 or above, we can see no obvious trend, but a rather irregular pattern of higher and lower years. The large peak in 1974 in the F3+ figure shows the Super Outbreaks that occurred that year as well as those in 1965 and 1967. (See Tornado Outbreaks:Twisters En Masse.)
From the original observed tornado curve, it is obvious that the first interpretation is true, the number of observed tornadoes has dramatically increased over the last half century or so. The adjustment by Brooks and Carbin and the time series of severe tornadoes, however, seem to show that there is no strong trend in the data to suggest an increase or decrease is due to changing climate. It must be strongly emphasized that an observed trend, or lack of one, is not causation, and understanding of changes in tornado frequency or strength with changing climate patterns will only come with more research and perhaps a longer observation record.
One Good Trend
One observation trend that is obvious and real is the downward trend in the number of deaths due to tornadoes over the same period. If one were to look strictly at the number of tornadoes reported (unadjusted), it would not be illogical to expect a similar rise in tornado deaths, particularly with the population increases in many of the most prone areas during that time.
The graphs below, courtesy of Harold Brooks and Charles Doswell show the total number of tornado related deaths in the US from 1880 to 2000, and the more telling trend in deaths per million population (updated to 2008) that shows a strong downward trend since the end of WWII.
US Tornado Fatalities: 1950-2011 From Brooks and Doswell, Courtesy US NOAA National Storm Prediction Center
Tornado Death Rates per Million Population: 1950-2012 From Brooks and Doswell, Courtesy US NOAA National Storm Prediction Center
With a few exceptions such as in 2011 when tornadoes hit major population centers, often at night, there has been a steady decline in the number of tornado deaths. I see this as a tribute to both the national severe storm warning system and the improvements in the observational and communications networks that pinpoint storms at touchdown. I include my kudos to those true storm chasers who act as the eyes in the field. Of course, we also cannot forget public awareness of the threats and the taking of appropriate safety measures when tornadoes are imminent.
That said, it was disconcerting to me to have read on Accuweather, the article “Science and Psychology: Why People Ignore Tornado Warnings” by Molly Cochran. Part of the answer is that people become desensitized to the threat after a while, particularly if no tornado of note occurs during a tornado warning. Too many such events, leads to the “cry wolf syndrome”, where warnings with no events cause people to loose faith in the warning's accuracies. This happened in northern Illinois in the summer of 1965 after the deadly Palm Sunday tornadoes when just about every severe thunderstorm that passed through had the village warning sirens activated.
I hope that this is not a general trend — there will always be those who will ignore warnings for a variety of rationalizations — particularly in 2013 when the dearth of tornadic storms has continued through much of the first five months. We are perhaps a too optimistic people these days, thinking it won't happen to us. We continue to build on fault lines and flood plains and unprotected shorelines.
May and June usually see 40 percent of the tornado activity of the year in the United States. Even in this extreme year of lack of storms, it is no time to relax our guard.
Learn More From These Relevant Books Chosen by The Weather Doctor


 This month, I want to look at tornadoes from a climatologist's point of view, and in some respects, continue on with last month's discussion on normals and rare events. As of this writing, the United States was finishing a stretch with one of the lowest number of tornado occurrences in modern records.
 Given that a good number of tornadoes are viewed by dozens, and perhaps hundreds of eyes, how do we count the actual number of storms given that observers may be seeing the same storm from a different angle, different storms in a cluster, or perhaps misinterpreting an oddly shaped cloud, downburst, or rainshaft as a tornado?
 As a result, the number of storm reports generated during bouts of severe weather often greatly overstate the actual number of tornadoes. Assessment teams comb the reports and seek out the areas of storm damage to determine if indeed it was a tornado. Once the damage is established as from a tornadic storm, its EF rating must be determined along with any information that may shed light on its path, width, or duration.