Most of my readers do not know that my academic training began with a combined degree in meteorology and oceanography and that my Master of Science degree is in oceanography. My first research projects as an assistant meteorologist at the University of Michigan under Dr Don Portman were air-sea interaction work as part of Project BOMEX and a study of wave-winds interaction over Lake Michigan. When my career path shifted into air pollution meteorology via another of Dr Portman’s contracts, I left the water realm behind professionally for many years. However, I still retained an interest in marine weather. I did get in some further work a quarter century later in air-sea interactions, again looking a winds and waves.
One concept that grew in my mind over this period was the notion that the oceans had “weather” systems in their waters just like the atmosphere above them. We knew about the “general circulations” in the oceans but a lack of data over the broad surface of the ocean and beneath kept my ideas as a mind experiment. Now, extensive marine studies, coupled with satellite remote sensing, have brought substance to my guesses.
Our view of the oceans and their details are becoming clearer, and they will continue to do so as satellite sensing improves. But what about the past? Is there a way we can glean information from other sources that will help us understand the marine atmosphere and its linkage to global weather? It appears the answer is “yes.”
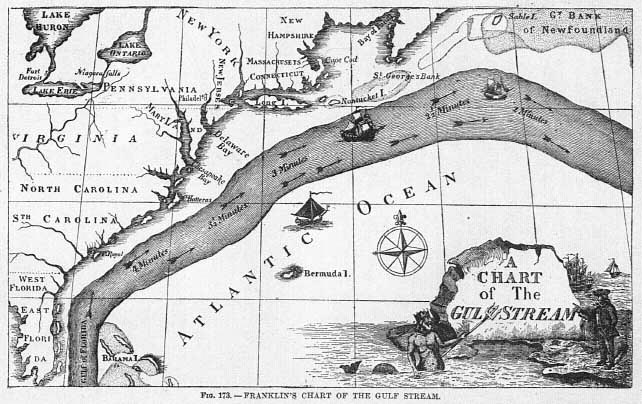
In a previous installment of Weather Almanac I discussed Benjamin Franklin’s work on the demarcation of the Gulf Stream through the use of the logbooks from sailing ships plying the North Atlantic waters. These logbooks and those of countless other mariners over the centuries still provide us with useful information on weather conditions over the vast global oceans. Today, these books are being gleaned for their information that can help enhance weather and climate data bases for use in various areas of atmospheric research.
The great oceans of the Earth cover about 71% of the Earth's surface (~360 million km2). The sun energy falls on this great surface and heats the upper water layers. As a result, large amounts of heat energy and water are transported by wind and currents that affect global and local weather/climate. Because the ocean surface is more homogeneous than the land, scattered observations in time and space can still be used, with the help of mathematical models, to reconstruct weather and climate conditions over the waters.
For most of the oceanic surface area, however, we have no regular weather observations, and for many of the islands and buoys, which now provide us with such data, the record is rather short, often only a few decades. However, several national and international programs are now in progress to digitize the weather information provided in ship logbooks. Several such projects enlist the help of volunteers across the globe to transcribe the log entries into a digital database.
The Historical Record
Perhaps the largest library of marine logbooks resides with in the United Kingdom where over 300,000 logbooks from as far back as the 1670s await digitization. Most of these are from British Royal Navy vessels for which the keeping of such logs was mandated by the Admiralty several centuries ago. Famous maritime personalities who set standards for these log entries include Admiral Francis Beaufort, whose wind scale categorized wind observations before anemometers became standard, and Admiral Robert FitzRoy, the father of the British Weather Service. And because the British Royal Navy roamed the world’s oceans from prime meridian to dateline and pole to pole, the coverage is extensive. Many valuable records are also available from warships plying the seas during conflicts such as the two world wars of the 20th Century. In addition to the British Royal Navy records, a large number of logbooks remain from the ships of the East India Company dating from the 1600s to the 1840s.
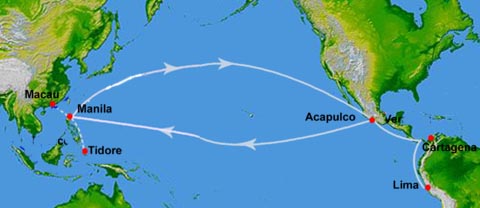
The Spanish Manila galleons provided useful information on the circulation of the tropical Pacific Ocean as they sailed between Manila, The Philippines and Acapulco, Mexico from 1590 to 1770. This was the longest continuous commercial marine route in recorded history. These voyages would take five to six months eastward and four months westward on a loop that took them north from the Philippines to catch the Kuroshio current and westerly winds across the Pacific to North America and returned westward under the northeast trade winds and the north equatorial drift. The voyages left Acapulco in late March and arrived in Manila in late June or early July. The return leg left in July and arrived early in the new year, January or February.
Typical Route Map for the Spanish Manila Galleons Courtesy NOAA
British, American and Spanish ship logbooks provide a rich source of information on hurricane events from the 15th Century (Columbus’ logs) to the 20th Century. This information can provide identification of storms not previously identified, precise dating of storm movements, their marine path, plus accounts of these storm’s impacts on the sea.
Ships of exploration and whaling ships from many nations offer invaluable coverage of the polar seas at latitudes where commercial vessels did not venture. Records of vessels searching for the Northwest Passage and the Northeast Passage have given us an important historical record of the ice coverage in the Arctic during the 19th and 20th centuries. Japanese whaling ships usually left Japan in October or November to reach the Southern Ocean during the Southern Hemisphere summer. They would return during March or April. During both legs, they would cross the warm waters of the equatorial region between 10 degree north and south of the equator, measuring its sea surface water’s temperature.
Marine explorers such as Captain James Cook and his protégées Captains George Vancouver and William Bligh were among the many explorers of the Pacific Ocean whose logbooks provide highly accurate measurements of wind, pressure, temperature and sea ice. Both FitzRoy and Charles Darwin kept weather records during the long voyage of HMS Beagle in the 1830s. Though Darwin’s are spotty, FitzRoy’s are standard British Royal Navy observations and give us extensive data for the ocean regions around South America. In a similar vein, the polar expedition headed by Sir William Parry in HMS Hecla provides extensive knowledge of conditions in the Canadian Arctic (1819-21) as he attempted to reach the North Pole. He also documented observations of the halo phenomenon later known as Parry arcs.
The Measurements
Most marine logbooks, particularly in the age of sail, kept records of wind speeds and direction, the former being subjective until the introduction of anemometers. However, in the days before accurate chronometers prior to the mid-18th Century, precise estimates of wind speed and direction allowed ship captains to determine their longitude, and thus fix their position.
Temperature and pressure observations on board ship became widespread after the Brussels Maritime Conference in 1853, and these are most useful today in reconstruction past weather and climate conditions on the seas as are measurements of sea surface temperatures. Since barometers and thermometers were expensive, and rather delicate, they were usually kept in the captain’s cabin. Temperature readings generally were made in the shade of the cabin. Sea water temperatures generally were taken by tossing a bucket overboard to sample the surface water and retrieving it. Then a thermometer was placed in the bucket soon after retrieval to measure the water temperature.
In the Royal Navy logbooks, weather observations were typically made six times per day and in some cases, hourly records were made of weather conditions, a much more detailed record than those kept on land until the late 19th century. During bouts with storms at sea, observations were often made more frequently than during steady fain weather conditions. And while none of the individual logbooks can give us useful climate information, the collection of many logbook records, taken over decades over an area, can.
Some Results
Already data from historical ship logbooks have been used in reconstruction of past weather and climate by scientists around the world.
One study by Dr Cary Mock, associate professor of geography at the University of South Carolina, has reviewed maritime records related to The Great Louisiana Hurricane of 1812. Using these old log records has uncovered new information about the storm’s intensity, where it formed, and the track it took. “It was a lost event, dwarfed by history itself,” said Mock. “Louisiana was just in possession by the United States at the time, having been purchased from France only years before, and was isolated from the press.”
Using ship logs, Ricardo García Herrera and colleagues were able to reconstruct more detailed histories of hurricanes hitting Cuba in 1768 and Puerto Rico in 1876. Other hurricanes were also discovered that had not been previously identified in any previous listings.
A.J.W. Catchpole and colleagues used ship logbooks to study 19th Century ice conditions on Hudson Bay and the Canadian Arctic. He found that exceptional ice conditions remained late into the year during the infamous cold summer of 1816.
Rolando R. Garcia and colleagues studied the data derived from the Manila galleon logbooks to infer changes in the atmospheric circulation across the tropical Pacific Ocean during the period 1590 to 1750. Such data can tell us about variability in the Asian monsoon and the El Nińo/Southern Oscillation.
Logbooks from ships seeking the fabled Northwest Passage, such as that from HMS Isabella beginning in 1818, have provided information about arctic sea ice. These data reveal a small but significant decline in Baffin Bay sea ice over the past 190 years.
The “old records” Projects
In order to digitize all that data, a small team of researchers would take decades to finish the task for the Royal Navy logbooks alone. A number of cooperative and volunteer programs are therefore currently underway to digitize weather records from ship’s logs. These include:
Data rescue at home, an internet-based attempt to digitize historical weather data from all over the globe has two projects currently online — German radiosonde data from the Second World War, and meteorological station data from Tulagi (Solomon Islands) for the first half of the 20th century.
The Old Weather Project administered by the University of Oxford that is currently focusing on British Royal Navy ship logs from World War I.
In the United States, NOAA, the National Oceanic and Atmospheric Administration, has run volunteer data extraction projects from historical ship logbooks as well as old diaries and journals.
In Great Britain, the Old Weather Project asks for thousands of on-line volunteers to help in the task. Working online from scanned pages of old British Royal Navy logbooks from the World War I period, participants are asked to find the date, the location of the ship, and the weather observations and then enter them into a form that will be added to a large digital databaseAs of this writing only 46 percent of the logbook extractions of weather observations are complete from logbooks made by British Royal Navy ships around the time of World War I. That figure (as of February 2011) accounts for records completed for 66 ships, amounting to 352,307 pages of entries.
If you are interested in the Old Weather Project, visit its website at http://www.oldweather.org/ for further information.
Learn More About Weather fFrom These Relevant Books Chosen by The Weather Doctor


 In a previous installment of
 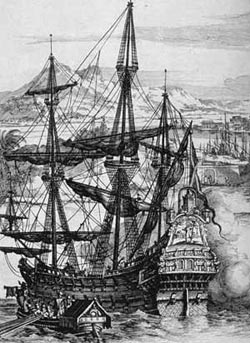 The Spanish Manila galleons provided useful information on the circulation of the tropical Pacific Ocean as they sailed between Manila, The Philippines and Acapulco, Mexico from 1590 to 1770. This was the longest continuous commercial marine route in recorded history. These voyages would take five to six months eastward and four months westward on a loop that took them north from the Philippines to catch the Kuroshio current and westerly winds across the Pacific to North America and returned westward under the northeast trade winds and the north equatorial drift. The voyages left Acapulco in late March and arrived in Manila in late June or early July. The return leg left in July and arrived early in the new year, January or February.
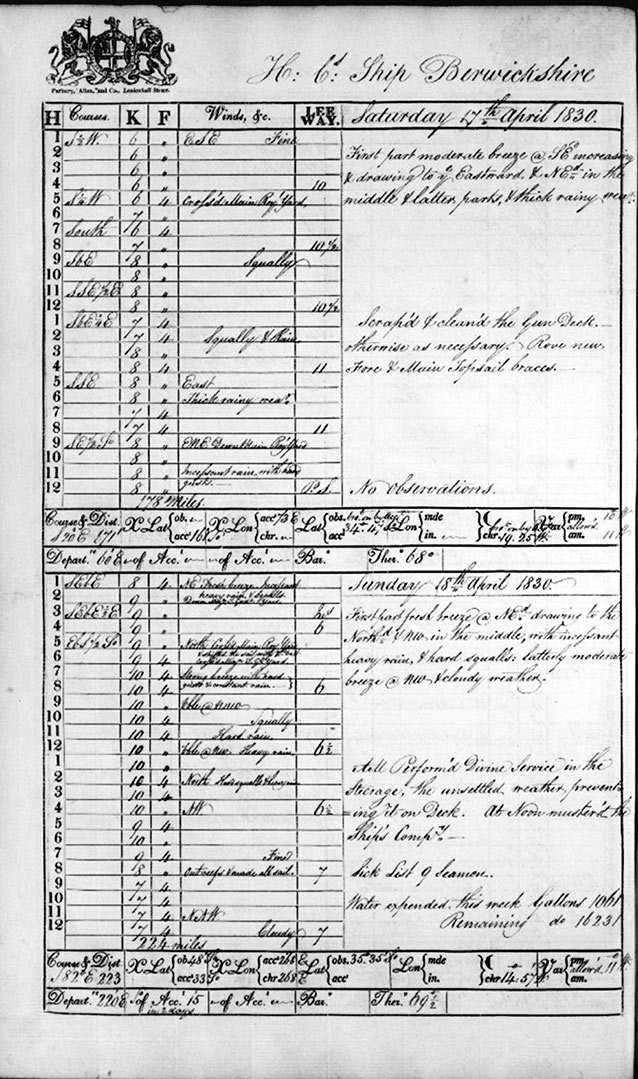 Most marine logbooks, particularly in the age of sail, kept records of wind speeds and direction, the former being subjective until the introduction of anemometers. However, in the days before accurate chronometers prior to the mid-18th Century, precise estimates of wind speed and direction allowed ship captains to determine their longitude, and thus fix their position.
 Using ship logs, Ricardo García Herrera and colleagues were able to reconstruct more detailed histories of hurricanes hitting Cuba in 1768 and Puerto Rico in 1876. Other hurricanes were also discovered that had not been previously identified in any previous listings.