| Home | Welcome | What's New | Site Map | Glossary | Weather Doctor Amazon Store | Book Store | Accolades | Email Us |
 | |||||||||||||||||||||||||
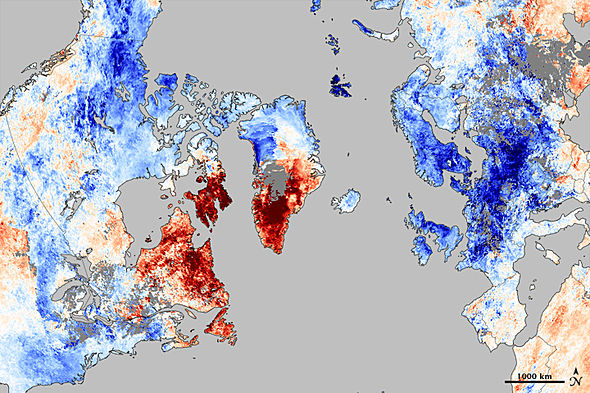
Weather Almanac for January 2011AO, NAO AND THE GREENLAND HIGHSince ending my formal education in meteorology some four decades ago, a whole new volume of vocabulary has entered the meteorological lexicon: not just the proliferation of acronyms that became popular in the 1960s and 70s, but new words and phrases to describe weather events. Some had long been in the vocabulary but were seldom used, such as derecho and El Nińo. Others arose as we developed whole new methods of analysis such as satellite imagery and the rich vocabulary of storm chasers like the bear cage and shelf cloud. Recently, a new term has come to my attention: Greenland High. No, it has nothing to do with mind-altering substances but is the cause of some of the extreme cold weather experienced in the winter of 2009 and December 2010 across eastern North America and Western Europe. The Greenland High, also known as the Greenland Block, is a cell of anomalous warm air that settles in over the island of Greenland and disrupts the upper air wind flow in the northern North Atlantic Ocean. (Technically, the Atlantic Ocean is called the North Atlantic Ocean north of the equator and the South Atlantic Ocean, south of that line. For simplicity, I hereafter use North Atlantic to denote the northern portion of the North Atlantic basin.) When the High remains stationary over the North Atlantic, covering from Iceland and Greenland back into the Canadian Arctic’s Baffin Bay, it becomes a blocking high that steers intensely cold air over Europe and the North American midsection. While these regions become abnormally cold, the region under the high — New England and the Canadian Maritimes northeast to Greenland and Iceland — warms anomalously. 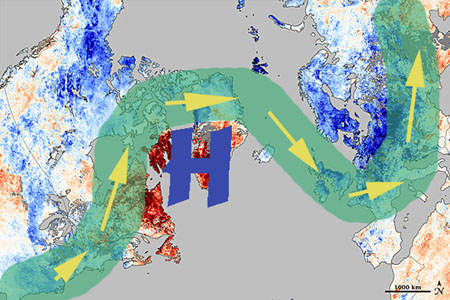 Greenland High and Block |
|||||||||||||||||||||||||
 |
 |
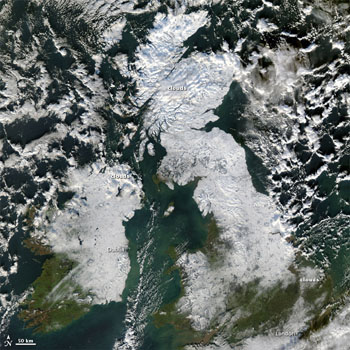
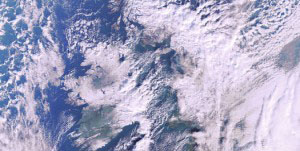
Snow cover for Great Britain on December 8, 2010. |
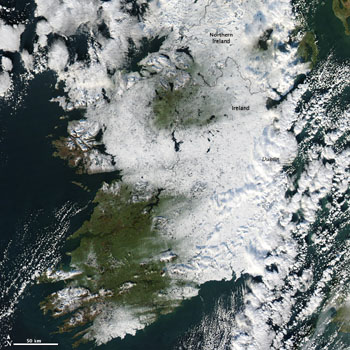
Snow cover in Ireland on December 2, 2010. |
After a brief respite, frigid arctic air that had its origins in Siberia again poured into Northern Europe bringing record cold to much of the continent in mid-December. The British Isles and Ireland were particularly hard hit. The media reported Northern Ireland was suffering under its worst winter weather in 25 years. On the 18th, the temperature at Castlederg, County Tyrone dropped to -18oC (-0.4oF), the lowest temperature ever recorded in Northern Ireland. Further to the south, the Spanish cities of Zaragoza and Huesca shivered on the morning of December 15 when the temperature stood at -4oC (24.8oF). On the 17th, Roman fountains froze and L’Aquila, Italy saw the temperature bottom out at -16oC (3.2oF).
The Greenland High block stalled a storm system over the northern Atlantic Coast of North America bringing record rainfall and flooding to New England and the Canadian Maritimes. From 13-15 December, the total rainfall from this storm had reached 208 mm (8.2 inches) in Baring, Maine; 174 mm (7 inches) in St Stephen, New Brunswick and 128 mm (5 inches)in Sydney, Nova Scotia.
Behind this storm system, a large mass of extremely cold air from the Arctic pushed southeastward. After crossing the Great Lakes, this cold air dumped heavy snow across the Great Lakes’ snowbelt. Syracuse, New York broke its December snowfall record by mid month with 70.8 inches (180 cm), and Lucan, Ontario was buried under nearly two metres of white (177 cm / 69.6inches).
The cold extended southward into Florida where daily low temperature and low maximum temperature records fell across the state over several days. The cold even pushed into the Caribbean, setting low temperature records in Cuba, Puerto Rico, the US Virgin Islands and The Bahamas. On 16 December, the temperature in Colon, Cuba fell to a low of 1.9oC (35.4oF), and several other Cuban cities registered their coldest day ever. Freeport in the Bahamas fell to 5oC (41oF) on the 17th, 2 Celsius (3.6 Fahrenheit) degrees above their all-time low.
The second outburst of cold into Europe at mid-month threatened to impact the holiday plans for many as most of the major airports from London’s Heathrow to Paris’ De Gaulle through Frankfurt , Germany and even into Greece and Bulgaria were forced to close or operate under reduced traffic just prior to Christmas. The greatest snowfall since 1985 buried Florence, Italy under a couple feet of snow, closing its airport. Italy's island of Capri recorded its first snowfall in 25 years. Snows even hit the Middle East with snow reported in Syria on the 12th and in Lebanon on the 13th.
The 2010 start to winter has similarities to the winter of 2009/10. Here are summaries for December 2009 and January 2010 derived from the State of the Climate Global Hazards report from the US National Climate Data Center.
A severe cold snap and a succession of snowstorms affected most of Europe from 11 to 22 December 2009. Heavy snow fell across Europe from Spain into the Ukraine. At least 90 people died across Europe due to the extreme weather conditions, including 79 people who froze to death in Poland where temperatures dropped to -20oC (-4oF). Portions of southern Germany saw temperatures of -33oC (-27oF). The snow forced airports to close in France, Germany, Belgium, the Netherlands, and the United Kingdom. Up to 20 cm (8 inches) of snowfall was reported across southeast England.
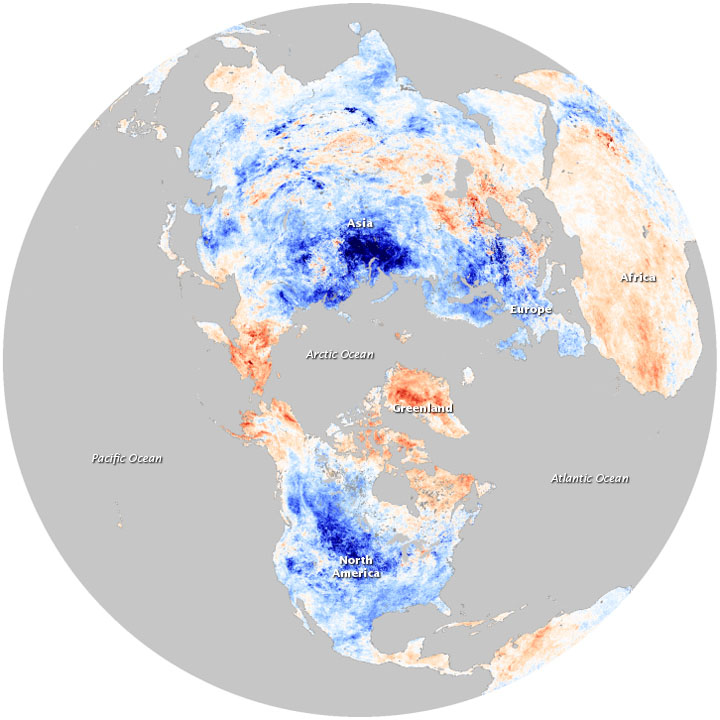
The images below shows the impact of the Greenland High and negative Arctic Oscillation on land surface temperatures throughout the Northern Hemisphere as observed by the Moderate Resolution Imaging Spectroradiometer (MODIS) on NASA’s Terra satellite. Cold Arctic air chilled the land surface at midlatitudes, while Arctic land areas, such as Greenland and Alaska, were much warmer than usual.
 |
 |
December 2009 Land surface temperature anomalies |
Air temperature anomalies for December 2009 |
The prolonged and severe cold snap and snowy weather that began in December across Europe continued into the New Year. In Geneva, Switzerland, heavy snow over the weekend of 8 January forced the busy airport that services the Alpine ski resorts to close. In Poland, at least 200,000 households were without power, and 1.5 meters (59 inches) of snow was reported in Leszno. Polish officials reported that 152 people froze to death across the country. The UK Met Office claimed this was the longest cold snap since 1981. Up to 41 cm (16 inches) of snow fell across portions of the United Kingdom, leaving most of Great Britain snow covered. At least 25 people died in Britain due to the weather. On 10 January, over 160 people were trapped in their cars along a German highway as falling and blowing snow drifted to 2 meters (79 inches). Snow fell as far south as Seville, Spain where for the first time in 50 years snow was reported.
As in 2010, the winter had a blocking Greenland High under a negative phase Arctic Oscillation, which channeled frigid arctic air southward over Europe. In contrast, warm temperatures prevailed in Greenland and northern Canada. Note the similarities of the generated temperature anomaly maps for the two periods. While the Arctic Oscillation may not have been the sole cause of the extreme weather — nothing in the atmosphere is ever simple — it certainly was a major influence.
The Arctic Oscillation (AO) and the North Atlantic Oscillation (NAO) are close relatives in the weather/climate family of Planet Earth, some say they are conjoined effects.
The Arctic Oscillation (AO) is defined (US National Weather Service Glossary). as: “a pattern in which atmospheric pressure at polar and middle latitudes fluctuates between negative and positive phases. The negative phase brings higher-than-normal pressure over the polar region and lower-than-normal pressure at about 45 degrees north latitude. The negative phase allows cold air to plunge into the Midwestern United States and western Europe, and storms bring rain to the Mediterranean. The positive phase brings the opposite conditions, steering ocean storms farther north and bringing wetter weather to Alaska, Scotland and Scandinavia and drier conditions to areas such as California, Spain and the Middle East. ... Some researchers argue that the North Atlantic Oscillation is in fact part of the AO.”
According to NASA, “The Arctic Oscillation is defined by the pressure difference between air at mid-latitudes (around 45 degrees North, about the latitude of Montreal, Canada, or Bordeaux, France) and air over the Arctic. A low-pressure air mass usually dominates the Arctic, and while higher pressure air sits over the mid-latitudes. This pressure difference generates winds that confine extremely cold air to the Arctic.” In the negative phase, the reverse pressure difference allows chilly Arctic air to slide south while warmer air creeps north.
Meteorologists Carl Gustav Rossby in the 1940s and Edward Lorenz in 1951 first recognized the oscillation between sea-level pressures in the arctic and mid-latitudes as an important phenomenon. The term Arctic Oscillation was first applied to the condition in 1998 by David Thompson and John Wallace.
When the AO is in its positive phase, the jet stream is pushed farther north than average, and storm paths are shifted northward of their usual paths. The higher surface pressure at mid-latitudes drives storms over the north Pacific and north Atlantic Oceans farther north, which brings wetter weather to Alaska, Scotland and Scandinavia, and drier conditions to western North America and the Mediterranean. In this phase, the frigid air during winter does not extend as far into the middle of North America as during the negative phase of the oscillation; therefore; generally the mid-latitudes of North America east of the Rocky Mountains, Europe, Siberia, and East Asia see fewer cold air outbreaks than usual during the positive phase of the AO. However, it leaves Greenland and Newfoundland colder.
Weather patterns in the AO negative phase, generally opposite to those of the positive phase, show higher-than-average air pressure over the Arctic region and lower-than-average pressure over the northern Pacific and Atlantic Oceans. As a result, the jet stream shifts south of its average position toward the equator. Consequently, the mid-latitudes are more likely to experience outbreaks of frigid, polar air during winter. In New England, the frequency of coastal Nor’easters is higher than normal during the AO’s negative phase. The major post-Christmas blizzard of 2010 that hit New England was a Nor’easter.
The graph below shows the running mean of the AO index going back to 1950. Red is the positive phase, blue is the negative phase. According to data from the NOAA Climate Prediction Center, the AO index value for December 2009 was -3.41, the most negative value since at least 1950. The AO has also gone “off the scale” in December 2010 at almost exactly the same time of the year as in 2009, the 10 days between 18 December and 29 December 2009. (Typically, the AO chart issued by NOAA extended over a range of between +4 and -4. However, in December 2010, the extreme negative state of the AO had literally gone off the scale of the NOAA charts, forcing NOAA extend the scale to between +6 and -6.) As a result, I expect the extreme value of December 2009 to be exceeded when the December 2010 data have been processed.
 |
 |
Running Mean Arctic Oscillation -- 1950-2010 |
Running Mean Arctic Oscillation -- 2010 Extension |
The North Atlantic Oscillation is one of the large-scale patterns of the planet’s climate system along with the El Nińo/Southern Oscillation (ENSO), the Arctic Oscillation and several others. This oscillation denotes the relative strengths of the semi-permanent pressure features over the Atlantic, the Icelandic Low and the Azores High, which have an out-of-phase tendency with one another. When one is higher, the other is lower. The oscillation is an indicator for significant changes in weather conditions over months to seasons and is most pronounced during the meteorological winter quarter (December through February). Unlike the Southern Oscillation, however, the NAO is almost purely an atmospheric mode and is not as regular in its beat as the ENSO.
The US National Weather Service Glossary defines the North Atlantic Oscillation (NAO) as “a large-scale fluctuation in atmospheric pressure between the subtropical high pressure system located near the Azores in the Atlantic Ocean and the sub-polar low pressure system near Iceland and is quantified in the NAO Index. The surface pressure drives surface winds and wintertime storms from west to east across the North Atlantic affecting climate from New England to western Europe as far eastward as central Siberia and eastern Mediterranean and southward to West Africa.”
The NAO index was first defined in 1924 by Sir Gilbert Walker, who also identified the Southern Oscillation. For him it showed “the tendency for pressure to be low near Iceland in winter when it is high near the Azores and south-west Europe.” It is closely related to the Arctic Oscillation, and there is debate on whether the two are separate entities and that perhaps the NAO is the North Atlantic expression of the AO.
The NAO has a great influence on the North Atlantic weather patterns during the months from November through April. The influence is particularly felt in Western Europe as it affects the movement, intensity and number of storms tracking across the continent. To a slightly lesser extent, it has impacts on conditions across eastern North America since it alters the paths of storms on that side of the Atlantic basin as well. For similar reasons, it also impacts the weather regimes downstream of Europe in northern Asia.
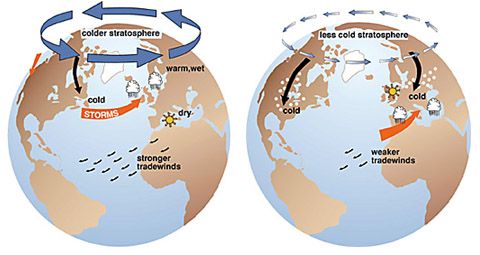
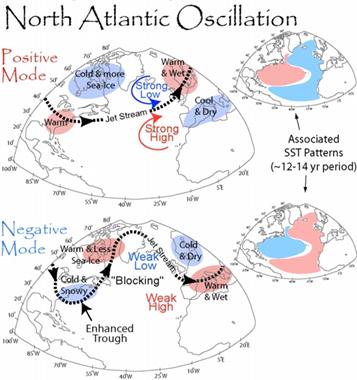
When the NAO is in its positive phase — a stronger Azores High and deeper Icelandic Low — more and stronger storm systems cross the Atlantic Ocean via a more northerly track. This causes warm, wet winters in Europe and in cold, dry winters in northern Canada and Greenland with the eastern US experiencing mild and wet winter conditions.
 |
 |
NAO in its positive phase |
NAO in its negative phase |
In the negative phase, with a weak Azores High and weak Icelandic Low and development of a strong Greenland High, fewer and weaker storms cross the Atlantic, taking a more southerly route, and their movement is zonal (west to east). This brings cold air on northerly winds to the British Isles and northern Europe. Moist air enters into the Mediterranean, at times extending through the Mediterranean to Cyprus and parts of the Middle East.. While Greenland experiences milder winter temperatures, the US East Coast sees more cold air outbreaks and hence snowier weather.
At this writing, we do not know if the negative phase of the AO/NAO will continue into January 2011, keeping Europe in conditions resembling the “Little Ice Age” or not. Unlike the El Nińo/Southern Oscillation, it can reverse rapidly. However, forecasts for the month ahead do not look encouraging as they suggest a continued strongly negative AO.
 |
Now AvailableThe Field Guide to Natural Phenomena: |
Now Available! Order Today! | |
 |
 |
Now |
The BC Weather Book: |


 On the eastern side of the Greenland High block, extreme cold had begun in November across much of Northern Europe. The first week of December was abnormally cold for much of Europe and parts of the United States. Great Britain and Poland saw some of the worst conditions. Strathallan, Scotland twice measured morning lows of -17oC (1.4oF) and Edinburgh, Scotland saw back to back lows at -14oC (6.8oF) with temperatures as low as -20.6oC (-5oF) in the Scottish Highlands. In central England, the first week of December reportedly was the coldest opening week of December since 1879. Temperatures slipped to -17.8oC (0oF) in northern England and Wales. In Poland, the intense cold was blamed for 114 deaths.