| Home | Welcome | What's New | Site Map | Glossary | Weather Doctor Amazon Store | Book Store | Accolades | Email Us |
 | ||||||||||||||||||||||||||||||||||||||||||||||||||||||||||||
Weather Almanac for August 2011HEAT WAVE July and August are typically the hottest months through the United States and Canada. I know this intuitively from pre-birth experience as the July-August period before my birth late in August was one of the hottest two-month periods in Chicagoland weather history. Heat waves are the deadliest weather phenomena in the United States. Heat kills more Americans, on average (around 1500, according to the US National Weather Service), each year than tornadoes and hurricanes combined. (Some sources place extreme cold as the number one weather hazard.) It has been 75 years since the greatest American heat wave, which struck the nation in July and August of 1936. It remains the hottest summer nationally in American history. Canada too suffered during this hot year on the North American continent as the Dust Bowl years desiccated the great prairies of both nations. Five of the US’s ten hottest summers struck during the decade of the 1930s. Many of the remaining have occurred since the start of the millennium with Summer 2006, the second hottest and Summer 2010, the fourth. What is A Heat Wave?Simply defined, a heat wave is an extended period of hot weather, often accompanied by high humidity or drought. What is hot weather, however, is a matter of local interpretation. A heat wave at high latitudes or elevation could be considered as chilly, or just comfortable, weather in the lower mid-latitudes, subtropics and tropics. The American Meteorological Society Glossary of Meteorology adds: “To be a heat wave such a period should last at least one day, but conventionally it lasts from several days to several weeks. In 1900, A. T. Burrows more rigidly defined a “hot wave” as a spell of three or more days on each of which the maximum shade temperature reaches or exceeds 90°F (32°C).”  This definition follows the old US National Weather Service general definition of heat wave, although they are moving toward using a heat index (HI) basis for the defining criterion, which incorporates humidity effects on human health as well. They now will initiate heat alert procedures “when the HI is expected to exceed 105° to 110°F (depending on local climate) for at least two consecutive days.” In Canada, the definition follows that of Burrows, except in Quebec where the temperature threshold is 30°C (86°F). In Northern Europe, where temperatures aren’t as hot as in North America, the temperature threshold is usually lower. In Denmark, a heat wave is a period of at least three consecutive days during which the average maximum temperature across more than half of the country exceeds 28°C (82°F). In the Netherlands, Belgium and Luxembourg, a heat wave is defined as period of at least 5 consecutive days in which the maximum temperature exceeds 25°C (77°F), provided that on at least 3 days during the period have a maximum temperature that exceeds 30°C (86°F). Australian temperatures are generally hotter, so the definition of a heat wave in Adelaide states there must be five consecutive days at or above 35°C (95°F), or three consecutive days equal to or above 40°C (104°F). Obviously, large desert areas such as the Sahara, the Australian Desert, and the North American Desert exceed these criteria almost continually during the summer months. It is my opinion that a heat wave should only be defined over those areas when the average temperatures are significantly hotter than the climate normal levels. Thus, a degree of departure from average or “normal” should perhaps be considered in the definition. (Can areas north of the Arctic Circle have a heat wave?) In addition, none of the above definitions consider overnight low temperature levels. Hot nights can have a great effect on both human comfort and health during hot spells. In many cases, this is also linked to humidity as lower nighttime humidity generally allows lower nighttime temperatures. Here in eastern British Columbia, peak summer temperatures may hit 35-40°C (95-104°F) for stretches, but the nighttime temperature often falls below 15°C (59°F) and may drop to less than 10°C (10°F). This allows a respite from the daytime heating. Prior to moving the British Columbia, I lived in the Great Lakes region (Chicago, Ann Arbor, Guelph) where high heat also meant high humidity and nighttime temperatures often remained above 25°C (77°F), and the night felt as uncomfortable, and potentially hazardous, as the daytime. CausesHeat waves normally occur in the summer months or early autumn and are generally associated with upper air patterns that allow hot tropical or subtropical air to flow northward. Such events can occur over short time scales, i.e. days to weeks, or they may be quite long, lasting stretching into months. Very often, heat waves are associated with severe drought such as occurred during the North American Dust Bowl years and in the Texas area in 2011. Drought provides several factors that exacerbate local heating. First, there are few clouds to reflect sunlight from the surface, thus allowing more solar heating of the surface than would occur under overcast or scattered cloud cover. Second, the lack of rain over an extended period results in depleted soil moisture. With a moist soil, some solar energy goes into evaporating water from the soil surface with the loss of heat through the evaporation cooling the soil. In a severe drought, however, there is no soil moisture, or very little, and thus the solar energy goes into heating the ground and the air layer above it. Finally, the string of dry, hot days allows soil heat to build, raising nocturnal temperatures and thus providing a higher starting temperature to the succeeding day. Upper air pattern changes preceding a heat wave may show the jet stream/polar front position moving northward, thus cutting off the flow of cooler polar or maritime air into the region. These changes can be long term and associated with changes in the upper airflow caused by either El Nińo or La Nińa or similar large-scale phenomena. At other times, an atmospheric block may divert cooler air and/or moister air away from a region for an extended period. Such conditions can lead to short-term drought with the attendant conditions for extra heating. In areas such as the Eastern United States, a strengthening of the subtropical high (the Bermuda or Azores High over the North Atlantic Ocean) will send a steady stream of hot, humid air into the region. A strong Bermuda High off the US Atlantic coast can send heat indices to hazardous levels from the Mississippi Valley to the East Coast. In Europe, streams of hot air flowing from the Sahara Desert in Northern Africa will produce heat waves. EffectsI have written about the impacts of heat and humidity on human health elsewhere on this website: Summer Discomfort: Mixing Heat and Humidity so I suggest you follow this link there for details. When our blood temperature rises above 37° C (98.6° F), our body attempts to disperse the extra heat by losing water through the skin and sweat glands, altering the rate and depth of blood circulation and, as a last resort, by panting. As body temperature rises, the heart rate increases and blood vessels dilate to increase blood flow from the body’s core to the skin’s surface. There, the blood is circulated through tiny capillaries threading around the upper layers of skin, and some excess heat drains off into the cooler atmosphere. At the same time, water moves from the blood through the skin, a process we refer to as perspiration or sweating. About 90 percent of the body’s heat is lost through the skin, and most of that is lost through perspiration. When the air temperature is greater than 37°C (98.6°F), heat can only be lost through sweating. In fact, at higher temperatures, moderate airflow, such as provided by fans or the wind, can actually increase the heating of the body by destroying the insulating still air layer adjacent to our skin and transferring the heat into the body. When the heat load exceeds the body’s ability to adjust, we begin to suffer ill effects. This progresses through a series of stages. These correspond to Heat Index ranges as defined by the US NWS (all temperatures in degrees Fahrenheit) to be:
Since HI values were developed to apply to shady, light wind conditions, one’s exposure to full sunshine can increase HI values by up to 15 F degrees. In addition, strong winds, particularly with very hot, dry air, can increase the hazard. Age, health, and exertion levels must also be considered when determining the HI ranges for these disorders. All three will push the thresholds lower. Acclimatization may nudge the thresholds a little higher. In studies done by Kalkstein et al., residents of Southern US states did not show the sharp spike in mortality rates during a heat wave that was found for residents of the Northern US states. Some Heat of the 21st CenturyWhile heat events warranted front-page news during the Dustbowl Years of the 1930s in North America, heat events in the United States (1972, 1983, 1988, 1995 and 1999), Australia (1924) and Great Britain (1976) also reached historic significance. Most notable was the 1995 event in the Midwestern US that took nearly thousand lives in Chicago, Northern Illinois and Wisconsin. The 1988 US event was more nation-wide, and between 5000 to 10,000 died due to the heat. In the first decade of the 21st Century, heat waves in Europe took many lives. In 2003, nearly 15,000 died from heat in France and another 20,000 in the rest of Europe. Temperature in Portugal peaked as high as 48 °C (118 °F).Three years later, another heat wave swept the continent with temperatures reaching 40°C (104°F) in Paris, 37°C (99 F) Great Britain and 35°C (95°F) in the Benelux countries and Germany. July 2006 was the hottest month every experienced in Great Britain as well as locations in the Netherlands, Denmark, Sweden and Germany. 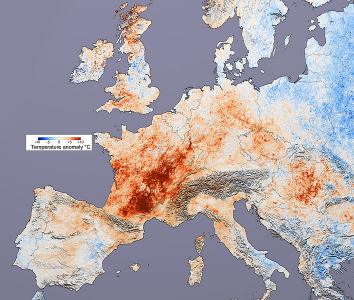 Compared to July 2001, temperatures in July 2003 were sizzling. |
||||||||||||||||||||||||||||||||||||||||||||||||||||||||||||
| Country | New Record Temperature | Date: 2010 |
| Belarus, Gomel | 39.2°C (102.5°F) | 8 August |
| Chad, Faya | 47.6°C (117.7°F) | 22 June |
| Cyprus, Lefconica | 46.6°C (121.3°F) | 1 August |
| Finland, Joensu | 37.2°C (99°F) | 29 July |
| Iraq, Basra | 52.0°C (125.6°F) | 14 June |
| Kuwait, Abdalyh | 52.6°C (126.7°F) | 15 June |
| Jordan, Marka Amman | 43.5°C (110.3°F) | 20 August |
| Niger, Bilmar | 48.2°C (118.8°F) | 23 June |
| Mayanmar (Burma) Myinmu | 47.2°C (117°F) | 14 May |
| Qatar, Doha Airport | 50.4°C (122.7°F) | 14 July |
| Pakistan, MohenjuDaro | 53.5°C (128.3°F) | 26 May |
| Russia (Europe), Utta, Lalmykia Republic | 45.4°C (113.7°F) | 12 July |
| Russia (Asia), Ust Kara, Chita Republic | 42.7°C (108.9°F) | 24 June |
| Saudi Arabia, Jeddah | 52.0°C (125.6°F) | 22 June |
| Sudan, Dongola | 49.7°C (121.5°F) | 25 June |
| Ukraine, Lukhansk | 42.0°C (107.6°F) | 12 August |
As a whole, the Northern Hemisphere experienced its warmest June, July and August, individually, on record and, therefore also experienced its warmest recorded summer (June through August), breaking the mark set in 1998 and subsequently tied in 2005. The summer was also the warmest for land-only temperatures, surpassing 1998.
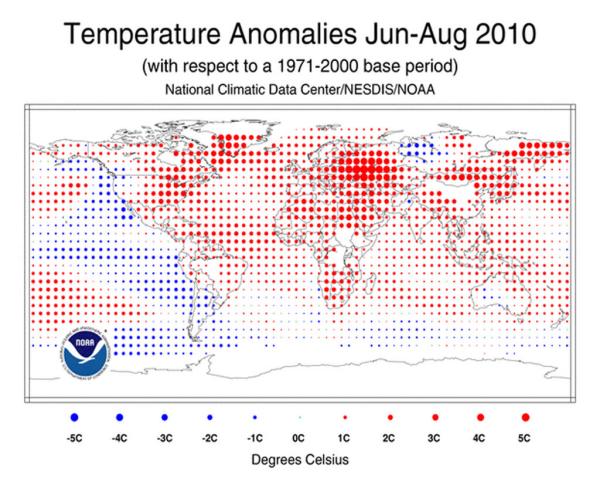
For a more detailed account of the Northern Hemisphere Summer 2010, click here: The Northern Hemisphere Heat Wave of 2010
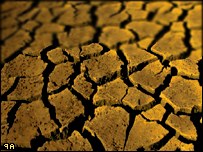 Texas is known for doing things big, including high summer heat, both dry (in the plains and desert areas of the west) and humid (along the Gulf Coast). As summer ascended over Texas in 2011, most of the state was in severe drought, which exacerbated the heating. Pecos, Texas, for example, had received no precipitation since 23 September 2010. This makes one of the longest rain-free periods in recorded history for a US city outside the desert regions of Arizona and California.
The opening month of the summer of 2011 saw the hottest June on record for the entire state of Texas since records began in 1885. This followed a May with temperatures much above average and their second warmest in history. Early indications for July suggest a month again much hotter than average.
For much of June, afternoon temperatures across Texas stayed in the triple digits Fahrenheit (above 38°C), with the hottest being 117°F (47.2°C) measured at the panhandle community of Childress on 26 June. Usually, daily peak summer temperatures in June occur in the deserts of Arizona and California, but in June 2011, the peak occurred in Texas on 18 of 30 days, with Pecos the national hot spot on eleven of those (peaking at 114°F (45.5°C) on 25 and 26 June).
At Laredo Texas on 22 June, the temperature had exceeded the 100°F (38°C) mark for the past 33 consecutive days before the high temperature dropped to 90°F (32.2°C) that day. When all days were tallied, June 2011 saw 28 days in Laredo above 100°F. The first 12 days of July started a new streak of triple-digit heat. In Pecos, 29 June days surpassed 100°F; a streak of 36 consecutive days began in June continues at this writing into July.
On 26 June, Amarillo, Texas recorded its highest temperature on record (since 1892) with 111°F (43.9°C). Borger and Dalhart, Texas also broke their all-time records that day with readings of 113°F (45°C) and 110°F (43.3°C), respectively.
In Houston, 26 days in June exceeded 95°F (35°C), with two of those days hitting the 105°F (41°C) mark—the hottest temperature ever recorded during June in that city. It was Houston’s warmest June on record, with an average temperature of 86.2°F (30.1°C), breaking the previous record of 85.9°F (29.4°C) set in 1906.
The heat spilled across most of the eastern United States and up from Texas through the Plains and into New Mexico, giving a strong start to a Summer 2011 heat wave across the United States. Thirteen states in addition to Texas recorded the month as one of their top-ten hottest Junes.
The hottest recorded temperatures broiled large portions of the Texas and Oklahoma Panhandles and southwestern Kansas on 26 June. In addition to the records set at Amarillo, Borger and Dalhart, the day registered the hottest temperatures of the month for Texas with 116.2°F (46.8°C) at Childress, Northfield, and Memphis (also in the Texas panhandle region). In Kansas, the temperature reached 114°F (45.5°C) at Ashland and 115°F (46.1°C) at Hugoton, both falling shy of the Kansas June record of 116°F (46.7°C) set in 1911. Dodge City, Kansas, where data go back to 1874, tied its all-time record with 110°F (43.3°C).
The heat continued in Texas and the Plains into July, finally spreading back into the southern California and Arizona deserts where the national hot spot is usually found during the summer months. (Six of the first dozen days saw national highs in California or Arizona; Texas had none.)
On 10 July, Hutchinson, Kansas baked under a high of 112°F (44.4°C) while Joplin, Missouri set a new record at 106°F (41.1°C). The temperature in Oklahoma City, Oklahoma and Dallas, Texas has reached or exceeded the 100°F (38°C) mark on 13 and 10 consecutive days, respectively as of 10 July. The previous day, Medicine Lodge, Kansas had sizzled at 114°F (45.5°C).
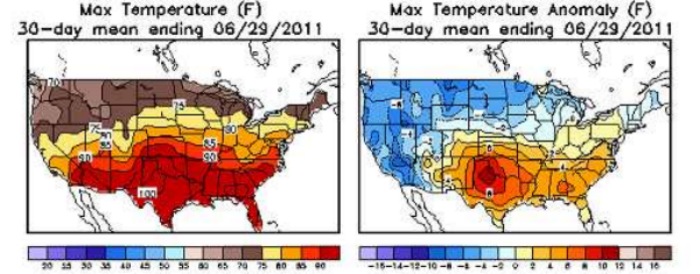
Most of the nation, from the eastern Rockies to the East Coast, from border to border, are running above normal into mid-July. With an upper-level dome of hot air more or less entrenched on the Plains, areas from Kansas southward are not forecast to be cooling down any time soon.
 |
Now AvailableThe Field Guide to Natural Phenomena: |
Now Available! Order Today! | |
 |
 |
Now |
The BC Weather Book: |


 Steve Wright has said: “If you saw a heat wave, would you wave back?” Well, I am sure folks down in the American Midsection particularly those in Texas would be happy to wave: Goodbye!!! The combination of extreme summer heat and a record drought sent July 2011 temperatures to new heights and durations of extreme heat (using the Fahrenheit benchmarks of 90 and 100 degrees). And Texans have been sending their extra heat northward into the Plains and Midwest states and eastward through the Gulf states to New England where triple-digit temperatures have been the norm rather than the exception for extended periods through the first half of the US Summer of ‘11.