| Home | Welcome | What's New | Site Map | Glossary | Weather Doctor Amazon Store | Book Store | Accolades | Email Us |
 | |||||||||||||||||||||
Weather Almanac for July 2009DEATH VALLEY: THE HEAT IS ONClimatologically, the hottest temperatures in the United States occur during the month of July. And within this large and meteorologically diverse nation, the acknowledged hot spot is found in Death Valley California. Indeed, the hottest temperature ever recorded in the US and North America occurred at Death Valley’s Greenland Ranch (now the site for the Furnace Creek Inn) when the mercury sizzled at 134oF (56.7oC) on 10 July 1913. The temperature that day set the record for hottest temperature ever recorded on the planet. This reading was not surpassed until the thermometer peaked at 136oF (45oC) at Azizia, Libya on 13 September 1922. It still ranks third in global heat records. 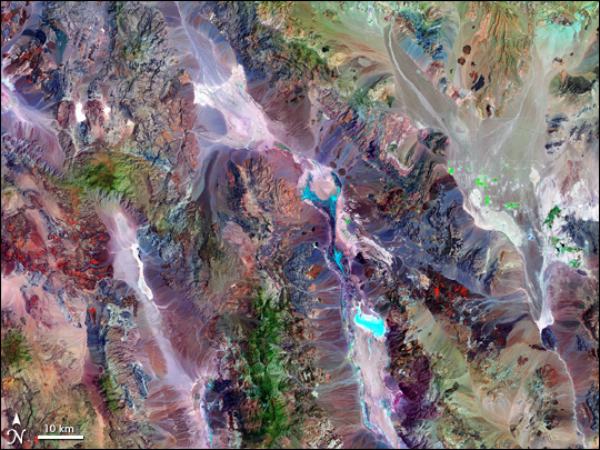 Death Valley National Park as compiled from Enhanced Thematic Mapper Plus |
|||||||||||||||||||||
 |
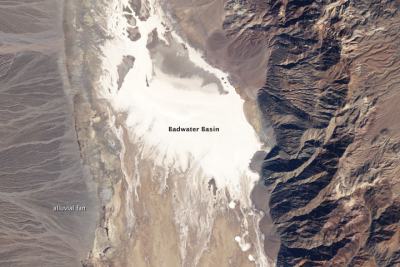 |
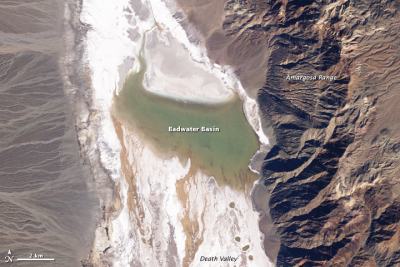
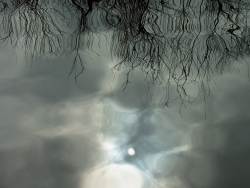
Lake Badwater, Death Valley on 9 February 2005 |
Lake Badwater, Death Valley on 15 February 2007 |
Landsat 5 Satellite Photos Courtesy NASA | |
From 1911 to the present, the main climate station has essentially been located at Furnace Creek (named in the climate records as Death Valley), though the exact present location has only been in use since 26 April 1960. Prior to that time the instruments were located at Greenland Ranch, a site very close to the current one. From 1 July 1934 to 31 December 1961, the official park climate station was at the Cow Creek Park Service Headquarters just north of the current climate station location. Normals quoted herein will be for the 1971-2000 period at Furnace Creek unless otherwise specified. Generally, extreme events quoted in this report occurred prior to 2003 which was the end of the period studied by Steven Roof and Charlie Callagan (The Climate of Death Valley, California, Bulletin AMS, 2003). A few instances between then and 2008 have been included, but I did no comprehensive study of the data to check for all extremes.
Death Valley is renown for its heat and aridity, ranking as one of the combined hottest and driest places in the world on an annual basis, although it is not the hottest and driest US location for every month of the year. The Normals mean annual temperature is 76.0oF (24.4oC) with a mean maximum temperature of 90.2oF (32.3oC). at the Furnace Creek climate station.
By comparison, the Normals mean annual temperatures at Miami Beach, Florida is 75.9oF (24.4oC) and Key West, Florida is 77.8oF (25.4oC), but their mean annual maxima are 80.3oF (26.8oC) and 82.9oF (28.3oC), respectively.
The winters are mild with average temperature of around 54oF (12.2oC), the average maximum temperature in December—January is 51.7oF (10.9oC). In contrast, the mean summer temperature averages at 98oF (36.7oC) with July averaging 100.6oF (38.1oC). Daily maximum summer temperatures average 112oF (44.4oC).
For precipitation, the Normals annual precipitation total is 2.33 inches (59.2 mm) at Furnace Creek, making it the nation’s driest spot. The 1911-2002 average was 1.9 inches per year (4.8 cm/yr). (Less likely falls in other areas of the valley. Some climate reports show total rainfall at nearby Cow Creek averaging less than 2 inches (50.8 mm) annually.)
In recent years, the region has received more precipitation than earlier years within the climatic record. For the first 65 years in the climate record, the annual precipitation total averaged about 1.6 inches (40.6 mm). The thirty years of the most recent Normals has seen an increase in average precipitation to 2.33 inches (59.2 mm) at Furnace Creek.
Of the Normals annual total, 1.37 inches (34.8 mm) falls between 1 December and 31 March. This winter rainfall originates in storms coming off the Pacific Ocean onto the California coast. In summer, such storms are blocked, and rainfall originates from the Arizona, or Southwest, Monsoon mostly falling from thunderstorms. Much of the area’s rainfall comes during intense single events lasting about a day. The total precipitation falling on the wettest day of the year generally contributes about a third of the annual accumulation. Only 18.1 days per year on average see more than a trace of precipitation fall and only 6.4 days accumulating 0.10 inches (2.5 mm) or above.
When intense winter storms hit the region, several inches of rain may fall over the course of few days, heightening the risk of flash flooding in the surrounding canyons. Thunderstorm rains can be hit-and-miss across the valley, drenching one location while other areas stay dry. One example of such an event occurred in September 2000 when 1.5 inches (38 mm) of rain fell at the Cow Creek Administration Office while none fell at Furnace Creek climate station, 3 miles (5 km) to the south.
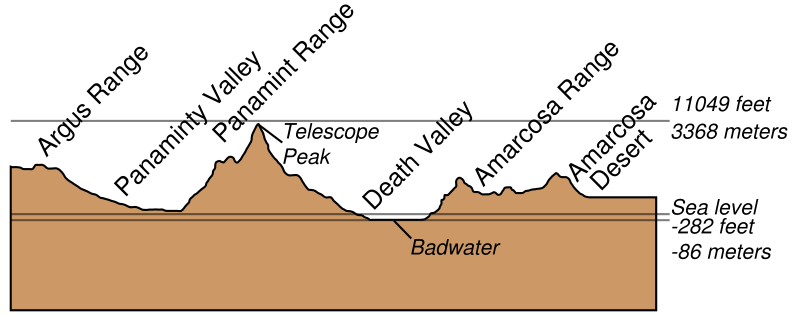
The aridity of Death Valley results in large part from its location east of four major mountain ranges — the Sierra Nevada Range, the White/Inyo Mountains, the Argus Range, and the Panamint Range — all of which diminish the moisture moving inland from the Pacific Ocean. By the time the maritime air mass reaches Death Valley, very little moisture is left to fall as rain. (These ranges successively deplete winter storms of their moisture by precipitating it out on the ranges’ western flanks as the air ascends over the ridge lines, leaving Death Valley in their rainshadow.) Often what moisture does fall as precipitation from the overlying clouds evaporates on its way down through the dry, hot surface layer.
Snow has fallen in Death Valley. The weather observer at Furnace Creek measured 0.5 inches (1.3 cm) of snow on the ground on 10 January 1922. There is a likelihood that snow also fell later that month around the 29th-30th. Local newspapers reported snow in the surrounding communities such as Stovepipe Wells, 16 miles (25 km) west of Furnace Creek, and the low temperatures for the period were 36° and 34°F (2.2° and 1.1°C), respectively. Since then, the official record is a trace of snow on 5 January 1974.
As one would imagine, the humidity levels in Death Valley are generally low, and during the summer, the relative humidity can remain below 30% for weeks at a time. This coupled with the high air and surface temperatures and windy conditions rapidly evaporates any standing fresh water. From standard evaporation pans, the typical summer daily evaporation is determined to be 0.75 inches/day (1.9 cm/day) from May through August with maximum rates at 1.50 inches/day (3.8 cm/day) during the summer. Over the long term (1961-2002), the annual total potential evaporation is 143 inches per year (363 cm/yr). This rate of moisture loss greatly exceeds the average annual precipitation of 1.9–2.2 inches (4.8–5.6 cm) per annum, making the region arid. Standing water and damp mud, however, can exist on the surface on the salt flats in Death Valley because evaporation is hindered by high salt content of the water.
Wind also plays a significant role in the dryness of Death Valley since it is a major component in evaporation. While there have been no long-term direct measurements of wind speed, the climate record does include daily wind movement data. This measure determines the wind movement per day by counting the total distance of wind moving past the anemometer during the measurement period. (Each rotation of the anemometer corresponds to a given “distance” of wind movement, and the meter’s counter clicks off the distance of “wind travel” in much the same way our car odometer counts miles travelled.) Average daily wind movement at Death Valley is lowest during the winter and peaks in early spring. From March to May the average daily wind movement is 250 to 300 miles (200-480 km) per day. Dividing that number by 24 hours gives a rough estimate of average daily wind speed: 10-4 to 12.5 mph.
It is the heat, however, for which Death Valley is best known. In the study by Steven Roof and Charlie Callagan, the authors suggest six likely factors for the Valley’s extreme heat:
Meteorologists know that the hottest days usually occur in Death Valley when a high pressure ridge centers over western Nevada. The ridge thus blocks cooler maritime air from pushing east while a thermal low located in southern California directs hot air from the deserts of southern Arizona and Mexico into the valley.
The second point above is particularly important since Death Valley is lower in elevation than most other desert areas in the United States In this process, the air sinking into the valley from aloft is heated adiabatically by compression, and that heat is retained in the air (here adiabatically means “without transfer of heat out of the air mass in question”). Since air heats adiabatically at a rate of about 1 Celsius degree per 100 m, air descending to the floor of Death Valley, about 80 m (262 ft) below sea level, would heat an additional 0.8 C degrees (1.4 F deg) more than a similar air mass descending to a sea-level desert surface. To put that into perspective, nearby Las Vegas has an elevation of about 2160 ft (659 m). If the temperature of the air over Las Vegas was 100oF (37.8oC), the same air descending to the floor of Death Valley would heat to 112oF (44.4oC)
 |
 |
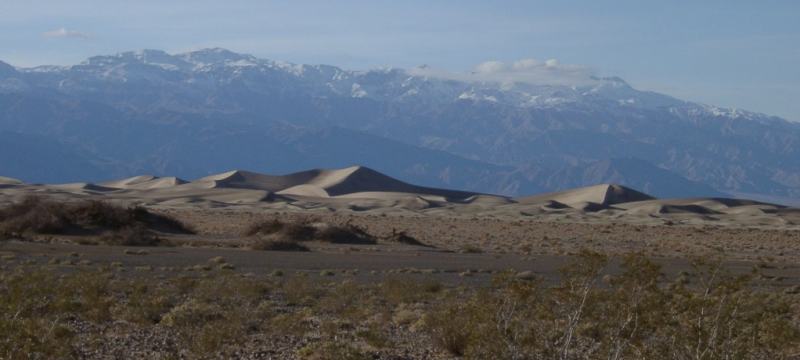
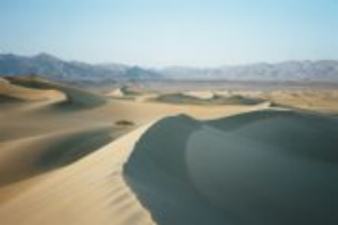
Death Valley Sand Dunes |
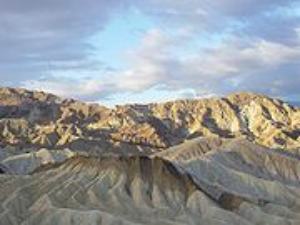
Zabriskie Point, Death Valley |
Photos Courtesy Wikimedia Commons | |
The average annual temperature for the 1971-2000 Climate Normals is 76.0oF (24.4oC). The warmest month July averages 100.6oF (38.1oC) with average high temperature of 114.9oF (46.1oC) and average low temperature of 86.3oF (30.2oC). The coldest month on average is December at 52.3oF (11.3oC) with average high temperature of 65.1oF (18.4oC) and average low temperature of 37.5oF (3.1oC).
The average number of days with maximum temperature above 100oF (37.8oC) in a year is 138. Nearly all days have a maximum temperature above 50oF (10oC): an average of 363.9 days per year. June, July, August and September, all have average maximum temperatures which exceed 100oF (37.8oC). It is an unusual day in July and August when the peak temperature does not reach 100oF (37.8oC). Only December and January have monthly record high temperatures below 90oF (32.2oC): 88oF (31.1oC) and 89oF (31.7oC), respectively.
While heat is the rule in the summer, winters in Death Valley can be much cooler. The December and January average daily temperatures at Furnace Creek are slightly warmer than those registered in San Francisco and cooler than Los Angeles. Daily minimum temperatures drop below 60oF (15.6oC) on about half the days in the year and sub-freezing temperatures (32oF/0oC) can occur between 1 October and 1 May. The coldest weather generally hits from late December to early January. Only 11.7 days per year see temperatures that drop to freezing or below.
The difference between a day’s minimum and maximum temperatures, the daily temperature range, generally averages around 30 F degrees (17 C deg), a few degrees greater than 30 F deg (17 C deg) in summer, a few degrees less in winter. The largest temperature ranges experienced at Furnace Creek usually fall within the 45 to 50 F deg (25-28 C deg) range. A few days, mostly in the autumn, experience temperature ranges greater than 55 F deg (31 C deg).
Temperatures cool as one rises above the low Death Valley floor by an average of 3-5 F deg (1.7-2.8 C deg) per 1000 ft (305 m) rise in elevation.
The Death Valley heat extremes began filling the record books in 1913, two years after the first permanent weather station was established the Greenland Ranch. On five consecutive days in July, the thermometer reached 129oF (53.9 oC) or above, peaking at 134oF (56.7 oC) on 10 July. That measurement held the global heat record for a decade until it was surpassed by the 136.4oF (58oC) recorded at El Azizia, Libya, in the Sahara Desert in September 1922.
(Note that while both of these temperature extremes are officially recognized as the hottest recorded temperatures for the world and for North America, there are some who dispute the validity of the readings on the grounds of the observational method and lack of thermometer calibration after the record reading.)
Since that record year, no temperature measurement has exceeded 129oF (53.9oC) in Death Valley. However several readings of 129oF (53.9oC) have occurred: 18 July 1960, 17 July 1998, 19 July 2005 and 6 July 2007. There have also been six readings of 128oF (53.3oC). Only one year 1960 has failed to register a reading of 120oF (48.9oC) or higher. (In 2009, the 120oF (48.9oC) mark was reached on 27 June and exceeded the next day.)
Death Valley, however, is not the only location in the United States to register high temperatures of 120oF (48.9oC) or above. Ten different states have recorded such highs including the Dakotas. In fact, Death Valley does not hold the national record for highest temperature in the month of June. That honor goes to Volcano in Amador County, California, reached 129oF (53.9oC) in June 1902. Death Valley ties for second, a Fahrenheit degree back, with Lake Havasu City, Arizona.
But when it comes to the hottest temperature in the contiguous United States on a daily basis, Death Valley stands out. Steven Dutch of the University of Wisconsin, Green Bay assessed the frequency various locations reported the highest temperature in the nation using the USA Today online database that stretches back to 1995. Dutch found Death Valley, accounted for 1022 high temperature readings or almost 19% of the total.
Summer 1917 saw 52 days when temperatures reached 120oF (48.9oC) or above, with 43 of them consecutive. The longest string of days with a maximum temperature of 100oF (37.8oC) or above was 154 days in the summer of 2001. The summer of 1996 was another scorcher with 40 days over 120oF, and 105 days over 110oF (43.3oC). July 2005 had 7 consecutive days (July 14-20) with high temperatures equal to or above 125oF (51.7oC).
The highest minimum temperatures ever recorded in Death Valley occurred prior to 1937: 110oF (43.3oC) in 1918, 1922, 1923, and 1924. Since then the hottest minimum temperature occurred on the night of 23-24 July 2003 when the temperature only fell to 104oF (40oC). Death Valley is also the only location in the US (and perhaps one of only two in the world) where minimum daily temperatures have been recorded at 100oF (37.8oC) or higher. Minimum daily temperatures of 100oF (37.8oC) or higher have occurred in ten of the years since 1937. In all but two years (1911 and 1912) on record, the highest annual minimum temperature has been 93oF (33.9oC) or above.
The highest ground temperature ever recorded was 201oF (93.9oC) on 15 July 1972. The air temperature at standard thermometer height that day peaked at 128oF (53.3 oC).
The hottest month ever was July 1917 averaging 107.2oF (41.8oC); the second hottest, and the hottest of modern record, was July 2005 averaging 106.5oF (41.4 oC).
The coldest month on record was December 1990 at 44.9oF (7.2 oC). The coldest recorded daily temperature was 15oF (-9.4oC) on 18 January 1913 (the same year as the record high). During the winter 1928/29, 72 consecutive days recorded temperatures at or below freezing. The lowest summer temperature since 1961 is 54oF (12.2oC) on 6 June 1996.
The wettest calendar year in Death Valley climate history was 1941 which saw 4.63 inches (118 mm) accumulate. The most precipitation over a 12-month period fell between 1 October 1977 and 30 September 1978: 6.40 inches (162 mm). Second was the period July 1977 to June 1978: 5.09 inches (129 mm). The wettest month was January 1995 when 2.59 inches (66 mm) accumulated. The wettest day was 15 April 1988 when 1.47 inches of rain fell. The only other day on record to exceed an inch of rain was 26 September 1997.
Death Valley precipitation records include calendar years with no precipitation: 1929 and 1953. A string of 40 months from 1 March 1931 to 30 June 1934, recorded a total of only 0.64 inches (16 mm).
Despite the intense heat of Death Valley, the national park hosts over a million visitors each year for camping, sightseeing, biking, hiking and star-gazing. Recently, visits have been increasing during the summer months as folks come to experience the unique summer conditions. Death Valley National Park is one of the largest protected desert wilderness areas in America with a many unique flora and fauna.
If you are interested in exploring Death Valley, the US Park Service has an online guide to the park available by clicking here.
 |
To Purchase Notecard, |
Now Available! Order Today! | |
 |
 |
Now |
The BC Weather Book: |