Tornadoes, hurricanes and their global cousins, blizzards and winter storms: All of these severe storms fill us with awe at their power and destructiveness. Prior to the last four decades, comparing storms was totally subjective and often tainted by the experiences of those who weathered the storm. Then in 1971, Dr Tetsuya Theodore (Ted) Fujita introduced his numeric scale for classifying tornadoes: the F-scale. That same year, engineer Herbert Saffir and pioneer hurricane expert Dr Robert Simpson developed a scheme for classifying hurricanes — the now-familiar Category 1 through 5.
While the Saffir-Simpson Hurricane Damage-Potential Scale could base its rating primarily on the maximum (1-minute) measured wind speed, tornadoes rarely had any direct measurements of wind speed from which to determine a rating. Thus, the Fujita Tornado Intensity Scale had to be determined after the fact from assessments of storm damage to human-built structures.
After over a quarter century of application of the Fujita Scale, it became apparent that the original scale and its defining attributes had weaknesses and had been misused. Even Dr Fujita recognized the need for improvement. Therefore, in the late 1990s, there was a growing consensus that the scale needed a tune-up, and the Texas Tech University Wind Science and Engineering Research Center proposed to undertake the revision work. In Spring 2001, a Fujita-Scale Forum was held in Grapevine, Texas, and subsequently the forum participants recommended where the Fujita Scale most needed revision. Using these recommendations, the Texas Tech group worked in conjunction with experts from around the country to devise an alternative to the original Fujita Scale.
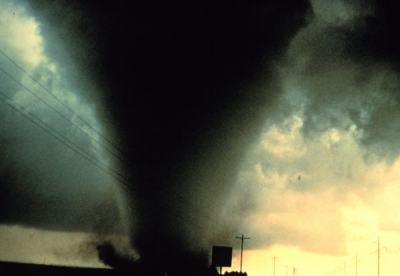
The Dimmitt (TX) Tornado photographed during Project Vortex, 2 June 1995
Courtesy: NOAA Photo Library, NOAA Central Library; OAR/ERL/National Severe Storms Laboratory
In early 2006, the National Weather Service announced plans to implement an Enhanced Fujita (EF) Scale to rate tornadoes replacing the original Fujita (F) Scale. That changeover commenced 1 February 2007.
The Original Fujita Tornado Intensity Scale
Prior to 1970, not much was known about the true strength of tornadic winds. Because of their relatively small size and short lifetime, direct measurements had not been made of any winds within a tornado. Even if one came close to a traditional wind sensor, the sensor rarely survived a direct encounter with the tornado. (Only with radar techniques were direct measurements possible, though some ingenious devices such as TOTO were employed to try to catch a tornado's wind.) There was, however, a great need to know about tornado wind speeds and the climatology of tornado strengths, particularly from the nuclear power industry who needed to know how strong to build reactor containment structures.
Professor Ted Fujita of the University of Chicago was one of the investigators who had participated in a three-year study of tornado events conducted under the sponsorship of NASA and NOAA. His observations of tornado damage led him to conclude that not all tornadoes were alike. Some were large in size, others small. Some destroyed only the weakest of structures, others were massively destructive to anything in their path. Therefore, there must be a means to distinguish these variations for practical uses.
Fujita introduced his plan to classify tornadoes and hurricanes in a paper entitled Proposed Characterization of Tornadoes and Hurricanes by Area and Intensity published in February 1971. He proposed to rank tornadoes based on a wind speed estimate derived from observations of damage and the tornado's size. First, he sought to connect his scale with two well-accepted speed scales, the Beaufort Wind Scale and the Mach number (derived from aerodynamic research, Mach number 1 denoted the speed of sound; Mach 2, twice the speed of sound), using a smooth curve. His F1 equivalent wind speed corresponded to Beaufort 12. An F0 level denoted tornado winds that would cause little or no damage. The upper level of the theoretic scale ended at the speed of sound Mach 1.
Fujita Scale wind speeds linked Beaufort Scale and Mach Scale Original diagram, T.T. Fujita, 1971.
In his study of tornado records from the US historical record Storm Data, Fujita found tornadoes covered an area of travel on the ground from 0.003 to 260 square kilometres. To determine an estimate of the areal extent of a tornado, Fujita used the Pearson path length scale and the Pearson path width scale. These two scales were developed by Dr Allen Pearson, then Director of the National Severe Storm Forecast Center. Fujita proposed that a tornado event could be characterized by its F-scale value and its values on the two Pearson scales. This gave rise to the FPP tornado scale, known as the Fujita-Pearson Scale. The Pearson scale components were eventually dropped, most likely because their values were based on actual measurements. On the other hand, there was no means of measuring the wind speed and this, according to Dr James R. McDonald of Texas Tech, allowed the F-scale to be widely accepted and to endure these many years.
The practical Fujita Scale was divided into six categories:
F0: Gale
F1: Weak Tornado
F2: Strong Tornado
F3: Severe Tornado
F4: Devastating Tornado
F5: Incredible Tornado
F-numbers 6 to 12 were characterized as inconceivable in nature and remained only as the link between F5 and Mach 1.
By assessing the damage following a tornado strike, Fujita believed a range of wind speeds could then be assigned to the storm. Fujita's wind speeds were defined as the fastest quarter-mile wind speed. The concept of fastest mile, or some variation on it, is not well known today. Simply, it is the time it takes for a "mile of wind" to pass the observer. Fujita reasoned that the damage caused by wind depended not only on the average wind speed measured over a short time interval but the time that wind was sustained. Of course, the faster the wind speed, the shorter the time needed to cause a specific level of damage. Thus, at highest wind speeds, extensive damage can be caused by short-term wind bursts or gusts. Fujita felt the fastest quarter-mile at the height of a damaged structure was the best application for his scale because it takes but a fraction of a "mile of wind" to cause damage to trees and weaker structures. Damaging wind speeds exceeding 150 mph, are essentially gusts (duration of 5 seconds of less).
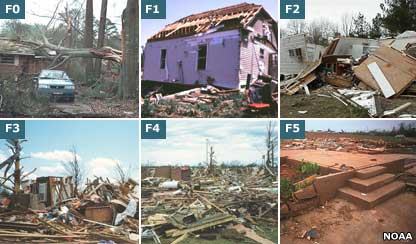
Examples of typical damage associated with F-Scale ratings. Photo courtesy NOAA, US Dept of Commerce.
The fact still remained that assigning an F-scale value to any tornado strike required a subjective assessment of the damage and rule-of-thumb estimates of what level of wind speed would cause various types of damage. Of course, the whole assessment is fraught with a wide variety of factors including the construction type and condition of structures damaged by the storm. Fujita developed a useful set of damage criteria for each level, which can be found in this table: Fujita Tornado Intensity Scale.
Fujita and his staff applied his criteria to damage surveys of each tornado in the Super Outbreak of 3-4 April 1974. Their report showed the usefulness of the method. As a result, all tornadoes since 1971 have been assigned an F-scale, and several historical studies have assigned scale values to all reported tornado damage. Perhaps the landmark work in this area was undertaken by Tom Grazulis who assessed historic tornado records with an eye to assigning an F value to all significant tornadoes (those of F2 or above) documented in American records. His work became the basis for the monumental volume Significant Tornadoes 1680-1991.
When Fujita proposed his damage scale, he recognized that it could also be applied to hurricanes or extratropical storms, particularly in areas where wind measurements were not available. Though we use the Saffir-Simpson system for larger-scale hurricane categorization, the Fujita Scale still has potential applications for assessments today, particularly on the meso-and microscales of wind damage.
The Enhanced Fujita Scale
Over the years, many including Fujita himself recognized weaknesses in the method for assigning the ratings. One particularly glaring deficit was the inability of a tornado to be ranked if it did not hit any structures.
A listing of the prime weaknesses of the F-Scale complied by the Fujita Scale Forum review committee included:
It is subjective based solely on the damage caused by a tornado,
No recognition in difference in construction,
Difficult to apply with no damage indicators,
Subject to bias,
Based on the worst damage (even if it is one building or house),
Overestimation for wind speeds in storms greater than F3.
As well, the F-Scale had its misuses over the years:
Placing too much reliance on the estimated wind speeds,
Oversimplification of the damage description,
Judging the F-scale by the appearance of the tornado cloud,
Not recognizing the weakness of structures such as mobile homes and modified homes.
The review committee also felt it necessary to continue to support and maintain the original tornado ranking database, and thus the two estimation methods will be distinguished by calling the Enhanced Fujita Scale the EF-Scale and keeping the F-designator for the original scale. Thus, an F5 tornado will still be an F5, but the estimated wind speed associated with that tornado will be somewhat lower.
You can see the comparison of the estimated wind speeds associated with each level on the table Fujita Tornado Intensity Scale where both the old and new indicators are given.
The Enhanced Fujita Scale developed by the Texas Tech team is still an estimate of wind speed based on damage, but the damage estimate indicators are more detailed and rigorous than the original set. The EF-Scale uses three-second gusts estimated at the point of damage based on an assessed judgement of eight levels of damage to 28 indicators.
School - 1-story elementary (interior or exterior halls)
ES
16
School - jr. or sr. high school
JHSH
17
Low-rise (1-4 story) bldg.
LRB
18
Mid-rise (5-20 story) bldg.
MRB
19
High-rise (over 20 stories)
HRB
20
Institutional bldg. (hospital, govt. or university)
IB
21
Metal building system
MBS
22
Service station canopy
SSC
23
Warehouse (tilt-up walls or heavy timber)
WHB
24
Transmission line tower
TLT
25
Free-standing tower
FST
26
Free standing pole (light, flag, luminary)
FSP
27
Tree - hardwood
TH
28
Tree - softwood
TS
From estimates of damage on the indicators, a tornado strength can be assigned. The assessment tables are quite lengthy and well illustrated. The full details can be found at the website of the Fujita Scale Enhancement Project (http://www.wind.ttu.edu/F_Scale/default.htm) which includes a pdf version of the final report.
An example assessment provided by the Texas Tech team is as follows. "A tornado moves through a neighborhood and walls are knocked down of an area of homes. Here the Damage indicator would be #2, One or Two Family Residences (FR12). The typical construction for this fits being a brick veneer siding home. The DOD [degree of damage] would be a 9, most walls collapsed in bottom floor. Thus, the estimated winds would be 127-178 mph with the expected wind speed of 152 mph. Now, taking this number to the EF-Scale, the damage would be rated EF-3 with winds between 136-165 mph."
First Application
The National Weather Service officially began implementing the Enhanced Fujita Scale on 1 February 2007. Its first application opportunity came the following day when a tornado outbreak devastated areas of Lake and Volusia Counties in central Florida during the early morning hours. The path of destructions included the towns of Lady Lake and New Smyrna Beach. The discontinuous path stretched over 70 miles (112 km). Twenty-one fatalities were recorded within Lake County.
The NOAA damage surveys gave the following descriptions (http://www.srh.noaa.gov/mlb/surveys/020207/index.html).
"The first tornado began near Wildwood in Sumter County at 308 am and crossed into Lake County, lifting east of Lady Lake at 325 am. NWS Melbourne issued a Tornado Warning for Lake County at 306 AM. Post storm surveys indicated the tornado reached a peak intensity of EF-3 (155-160 mph) and had a track length of 16.5 miles. Eight fatalities were associated with the tornado."
"The second tornado touched down in rural Lake County at 337 am and impacted the Lake Mack area at 348 am before crossing into Volusia County and affecting Deland at 402 am, then lifted east of Interstate 4 at 410 am. NWS Melbourne issued a Tornado Warning for Volusia County at 352 AM. Post storm surveys indicated the tornado reached a peak intensity of EF-3 (160-165 mph) and had a track length of 26 miles. Thirteen fatalities occurred in association with this tornado."
"The third tornado formed in eastern Volusia County to the east of Interstate 95 at 422 am and remained on the ground until 425 am when it reached the intracoastal waterway in New Smyrna Beach. Post storm surveys indicated the tornado reached a peak intensity of EF-1 (100-105 mph) and had a track length of 3 miles."
Learn More About Tornadoes From These Relevant Books Chosen by The Weather Doctor
For More Weather Doctor articles, go to our Site Map.
I have recently added many of my lifetime collection of photographs and art works to an on-line shop where you can purchase notecards, posters, and greeting cards, etc. of my best images.


 Professor
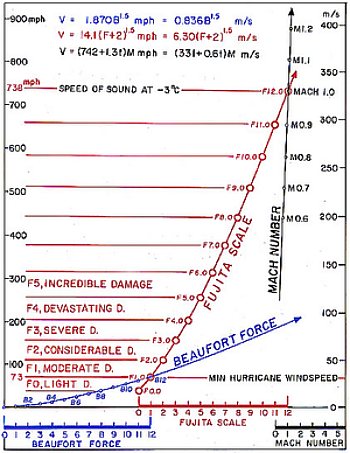
 Over the years, many including Fujita himself recognized weaknesses in the method for assigning the ratings. One particularly glaring deficit was the inability of a tornado to be ranked if it did not hit any structures.