| Home | Welcome | What's New | Site Map | Glossary | Weather Doctor Amazon Store | Book Store | Accolades | Email Us |
 | |||||||||||||||||||||||||||||||||||||||||||||||||||||||||||||||||||||||||||||||||||||||
Weather Almanac for May 2003GROWING BY DEGREESApril showers bring May flowers: the old folk-saying goes. But more truthfully, May warmth brings May flowers...and peas and beans, spinach and lettuce. Unless stressed by other environmental factors — lack of soil moisture being the most common — the development rate from emergence to maturity for many plants depends upon the daily air temperature. Similar thermal effects also occur in annual plants such as shrubs and trees. Cool temperatures slow the progress toward maturity or bio-matter accumulation, while warm temperatures hasten it. (Climatologists exploit this factor in reconstructing past climatic conditions from tree rings.)
For some plants, life cycle patterns change direction when specific environmental temperature levels are reached. For example, Boston lettuce (as well as other lettuce cultivars) forms full leafy heads when the daily growing temperature is in the 10 to 15 oC (50-60 oF) range. However, should the temperature rises for an extended period above 18-27 oC (64-80 oF), the plants will bolt, putting their growth energy into stem elongation and flower formation at the expense of additional leaf growth.
Above a crucial temperature, growth stops, usually with the organism's death. The temperature values of these critical change points on the curve vary with species and often between varieties. The following table gives some critical temperature values for several common vegetables.
Days to MaturityBefore widespread scientific research looked into the growth patterns of plants, farmers and gardeners watched their plants and kept a diary of botanical and weather events. The earliest studies observed the progress of plant growth from emergence to maturity, or some other stages of development, and counted the days that passed. (In March, I wrote about this science of phenology.) When averaged over a number of years, these simple phenological observations produced good rule-of-thumb estimates of growth progression that could be used in subsequent years. I recall one folk saying from my youth in the US Corn Belt that illustrates this point: "corn knee-high by the Fourth of July." This means that if the general stalk height in a corn field has grown knee-high by early July, then the crop is progressing as expected, and harvest should occur at its usual time. 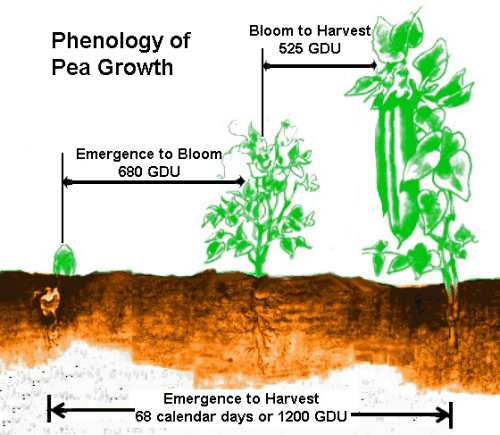 Green peas, for example, take about 68 days from seedling emergence to pod harvest. Such information, summarized in tables and maps for commonly planted species/varieties, is widely published in books and pamphlets. Pick up any seed catalogue or seed packet and you will likely see an indication of "days to maturity" alongside the variety (cultivar) description. We can use also use days to maturity as a guideline to produce crops that become ready for harvest at different times. One method is to plant different crop varieties which have different "days to maturity at the same time," say one plot of green peas that mature in 60 days and another of peas that mature in 68 days. The crops should, in theory, be ready for harvest about a week apart. Alternatively, we could wait a couple weeks and plant a second bed with 60-day peas, a practice known as staggered planting. In some years, however, a cool start to the growing season can result in both plots maturing at the same time. This strategy is not always the best for either the farmer or the home gardener, so more precise methods of determining crop progression with weather conditions have been sought. Growing Degree UnitsA more precise index for determining plant progress than counting days is the growing degree unit (GDU). In the past, this has been called the growing degree day (GDD). (I use the newer term because I find it less confusing.) Growing degrees (GDs) is defined as the number of temperature degrees above a certain threshold base temperature (Tbase), which varies among crop species. The base temperature is that temperature below which plant growth is zero. The GDU concept assumes that growth is a linear function of temperature from the base temperature to the maximum tolerable temperature (the dashed straight line on the S-curve shown above). For most basic applications, this is not a bad assumption.
Since � (Tmax + Tmin) is the daily mean temperature (Tmean), it can be used if Tmax and Tmin are not available, thus,
If the calculated GDs value for a given day is negative (the mean temperature is less than the base temperature), then it is assumed no growth occurs, and a value of zero GDs is assigned for the day. GDUs are accumulated by adding each day's GDs contribution as the season progresses from planting, emergence, or some other predetermined start date. The concept asserts that certain stages of the crop's development are reached when the cumulative GDUs pass the value specific for that crop species/variety.
GDUs have many practical applications; for example, they can be used to:
The above figure shows the GDUs for peas needed to grow from emergence to bloom and bloom to harvest. Crop Heat UnitsBefore I close, I mention one improvement on the growing degree unit concept. GDUs assume a linear relationship between growth and temperature based on a daily mean temperature. While relatively easy to calculate, accumulated GDUs might not be as exacting as some growers would like. In agrobusiness, exactly-timed application of resources can often make the difference between profit and loss. For example, knowing a precise date for the most effective pesticide application rather than applying the pesticide continuously over a set calendar period can often save on materials (and thus expense) and reduce unwanted collateral ecological impacts.
The relationships for corn expressed in Celsius degrees are:
Daily crop heat units are calculated and accumulated through the season, similar to growing degree units. For corn, the daytime relationship uses 10 oC as the base temperature and 30 oC as the optimum temperatures. Corn growth and development does not progress when daytime temperatures fall below 10 oC, and they are fastest at about 30 oC. The nighttime relationship uses 4.4 oC as the base temperature and does not specify an optimum temperature because nighttime minimum temperatures very seldom exceed 25 oC in Ontario where Brown developed the initial corn heat unit index. Extension of the research to warmer areas in the United States has added a term to account for higher nighttime temperature effects. Concepts such as crop heat units and growing degree days are not only practical measures for current crop production, they can also be used climatologically to determine the best cultivars or crops for given agricultural areas. State and Provincial agriculture agencies produce maps of expected annual accumulations for these indices. (For an example, see this Manitoba site.) Seed companies producing new cultivars advertise their CHU requirements in their catalogues along with other cultivar characteristics.  Given a wide choice of cultivars with differing heat requirements to choose from and the availability of long-range, seasonal temperature forecasts, growers can sow a more productive cultivar (yield or price per bushel) under the forecast growing-season conditions, or perhaps hedge their bets by mixing cultivars among their acreages. As I drive out of the city, I see the local farmers out planting their fields. I know that some of that acreage is for corn. When July begins, I will look again at those fields in passing and ask myself: "Knee-high by the Fourth of July?" Written by
|
|||||||||||||||||||||||||||||||||||||||||||||||||||||||||||||||||||||||||||||||||||||||
 |
To Purchase Notecard, |
Now Available! Order Today! | |
 |
 |
NEW! Now |
The BC Weather Book: |


 Watching the temperature in May and following months can be crucial to those growing plants for food or
specific ornamental uses. That is why most of my examples here refer to agricultural plants. Growing
commercially-valuable plants often requires attention to details in the crop's life cycle to ensure an
economically viable harvest. Thus, there arises a need for farming "by the numbers" — that is, using
scientific models and environmental observations in cultivation practices.
Watching the temperature in May and following months can be crucial to those growing plants for food or
specific ornamental uses. That is why most of my examples here refer to agricultural plants. Growing
commercially-valuable plants often requires attention to details in the crop's life cycle to ensure an
economically viable harvest. Thus, there arises a need for farming "by the numbers" — that is, using
scientific models and environmental observations in cultivation practices. The rate of growth variation with temperature for most plants (and many "cold-blooded" animals) follows
what is commonly called an S-curve because of its shape. There are several stages on this rate-limiting
growth curve:
The rate of growth variation with temperature for most plants (and many "cold-blooded" animals) follows
what is commonly called an S-curve because of its shape. There are several stages on this rate-limiting
growth curve: GDs are calculated for each day using the observed maximum (Tmax) and minimum (Tmin) daily
temperatures and the base temperature (Tbase) for the plant of interest by:
GDs are calculated for each day using the observed maximum (Tmax) and minimum (Tmin) daily
temperatures and the base temperature (Tbase) for the plant of interest by: As a result, agroclimatologists developed alternate indices that employ separate equations for the influence
of the daily minimum (nighttime) and the maximum (daytime) temperatures on growth. Professor Murray
Brown, one of my graduate school profs, at the University of Guelph developed the first of these indices for
corn, which he named the corn heat unit. Subsequent research has shown the basic procedure applicable to
other crops and the technique is now referred to as crop heat unit (CHU).
As a result, agroclimatologists developed alternate indices that employ separate equations for the influence
of the daily minimum (nighttime) and the maximum (daytime) temperatures on growth. Professor Murray
Brown, one of my graduate school profs, at the University of Guelph developed the first of these indices for
corn, which he named the corn heat unit. Subsequent research has shown the basic procedure applicable to
other crops and the technique is now referred to as crop heat unit (CHU).